UPDATE 2018-10-30: The DisplayFolders are supported in Analysis Service 2016 and later versions – see DisplayFolder documentation for more updated content. This article is relevant only for Analysis Services 2012/2014 and models in compatibility level 1100/1103.
However, if you have dozens of measures in the same table, you might look for a better organization of the list of measures available in the data model.
Tabular leverages the existing infrastructure of Multidimensional cubes. This means that you can reuse the same features of Multidimensional allowing the model designer to organize measures and attributes in a hierarchical structure.
In Multidimensional, you can organize the measure in folders, which can have a hierarchical structure. There are no semantic consequences for putting measures in folders. It is only a visualization technique, which does not alter in any way the underlying calculation.
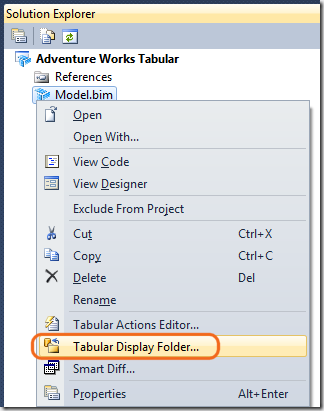
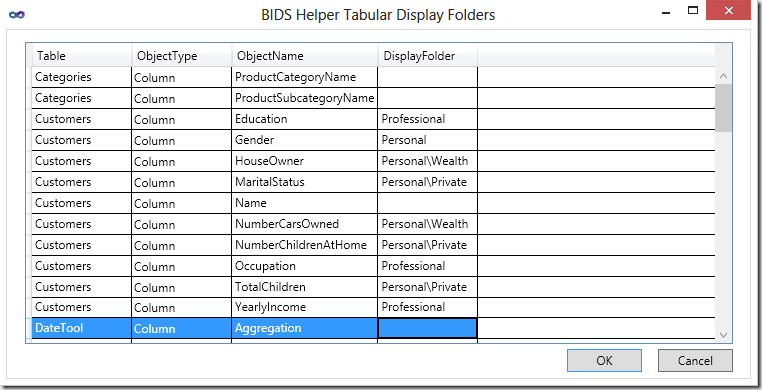
In Tabular, the standard user interface provided by Visual Studio does not offer a way to manipulate such a setting. Nevertheless, you can define the folder in XMLA code. The good news is that BIDS Helper has a feature that enables manipulation of the DisplayFolder setting.
If you want to create a folder hierarchy, you can use the backslash character in order to separate level names of the hierarchy.
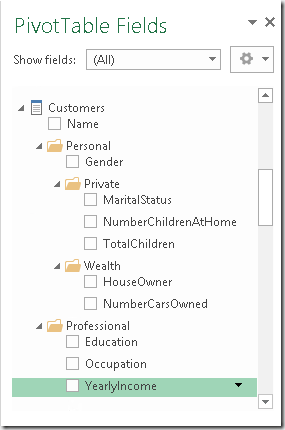
The final result in Excel is a hierarchical display of attributes in a dimension (like the Customer dimension in the following example).
You will find more information about defining folder settings for a measure on Tabular Display Folder page in BIDS Helper documentation.
 Marco Russo

