 Alberto Ferrari
In a Tabular model and in Power BI, one column can be sorted using a different column. For example, we sort the month name by the month number, obtaining the sequence we are used to (January, February, March, …) instead of the default alphabetical sorting order (April, August, …). Generally speaking, the month number is the sort key, whereas the month name is the sorted column.
In order to use a column as the sort key for a sorted column, there is a definite requirement: For each value of the sorted column, there must be one and only one value for the sort key. In other words, the relationship between the sort key and the sorted column must be one-to-one. Therefore, we need 12 month numbers to sort the month name. However, if the month name column includes the year (such as “January 2007”), then we need 12 values for each year in the Date table.
In most scenarios, this restriction is not an issue. If you think about the months, March always comes after February. Therefore, no matter how you filter, slice and dice your data, the order between February and March is written in stone.
However, there are scenarios where the sort order depends on the selection and the same value can be before or after other values. These scenarios are trickier to solve. To be honest, they are also fun problems to work out! Let’s see an example.
We created a simple model by downloading the USA 2010 census information. Then we restricted the data to only the counties and removed all the small counties – counties under 45,000 residents. The reason for this massaging of the data is purely aesthetic: we wanted less data and we wanted there to be duplicates. Based on this dataset with one single table, we created the following report which isolates three states.
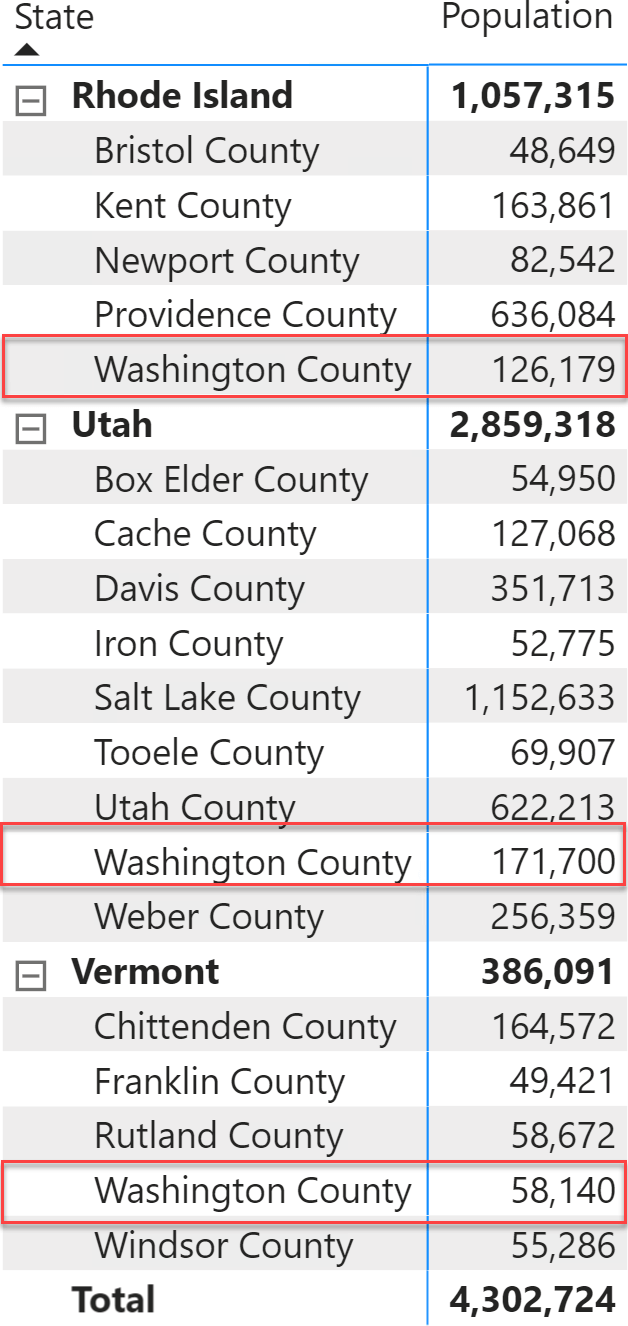
There are three different “Washington County” in three different states. We chose states with a small number of counties just to reduce the report size. States and counties are sorted alphabetically, with the default settings.
If you were to choose a state with more counties, there are a lot of options. It would be great if the report were able to show the most relevant ones first, which can be achieved by sorting the counties by number of residents. This way, the larger counties are shown first.
We can sort the full matrix by Population, but doing so involves some limitations. This is shown in the picture below. On the left, the original matrix; on the right, we have the same matrix sorted by Population in descending order.
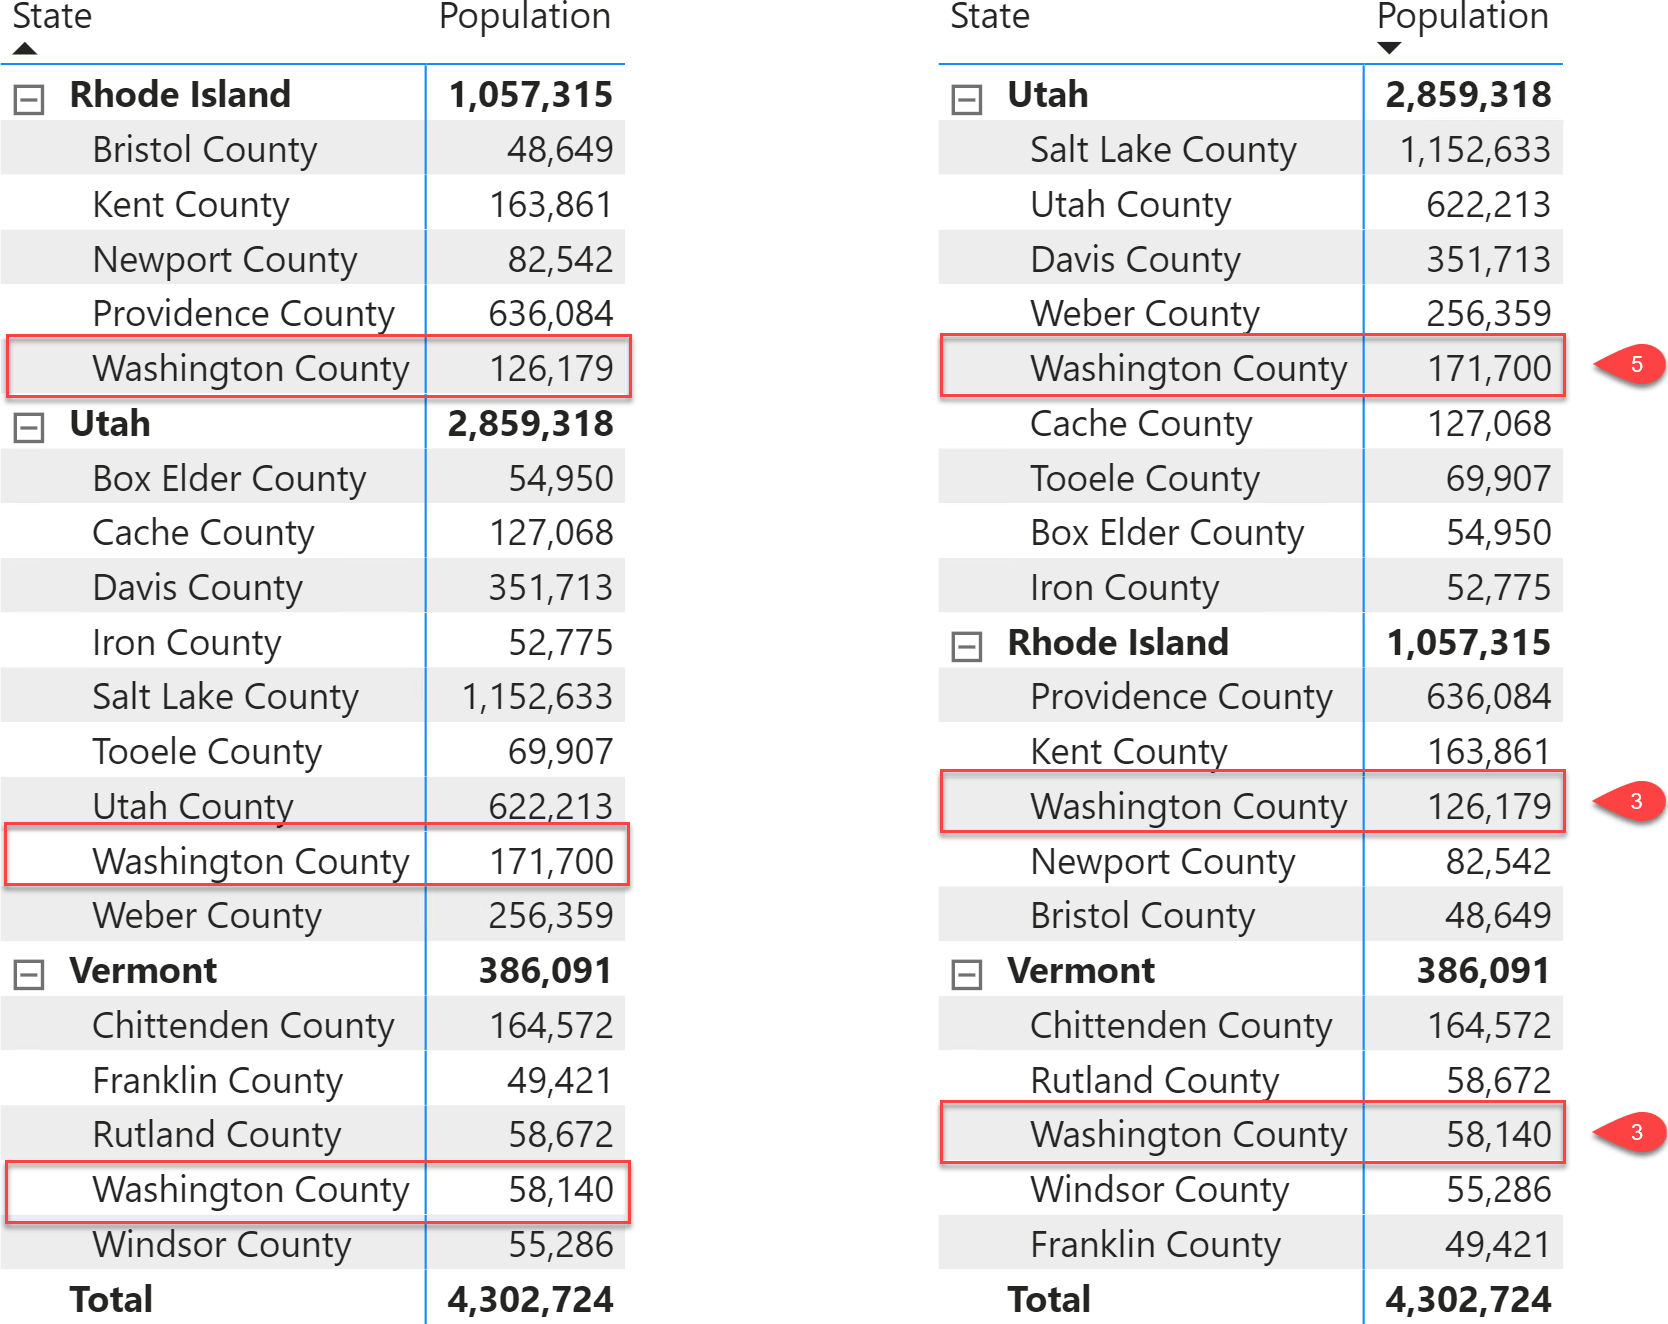
There are at least two problems. First, we wanted to sort the counties, but we ended up sorting the states too. Second, the Population measure must be present in the matrix. You cannot sort a matrix by a column that is not part of the report. For example, if we want to keep the same sorting order in a slicer, then we cannot rely on Power BI to sort the visual by a measure.
It would be better to use a sort key for the County column so that its sorting order depends on Population. Unfortunately, it turns out that the same “Washington County” has three different positions in different states. It comesfifth in Utah, third in Rhode Island, and third again in Vermont. There are 15 different Washington counties in our sample dataset, and we isolated only three states for the sake of simplicity. For sure, their sort order can be different in every state. Moreover, there are likely multiple counties with exactly the same number of residents. Therefore, Population cannot be directly used as the sort key because it might be non-unique.
We have two problems to solve. First, sorting the same value in the County column with different sort orders depending on the state. Second, using a sort key that – though based on Population – cannot be just the Population itself because of possible duplicated values.
The final goal is a model that makes it possible to create a report like the following.
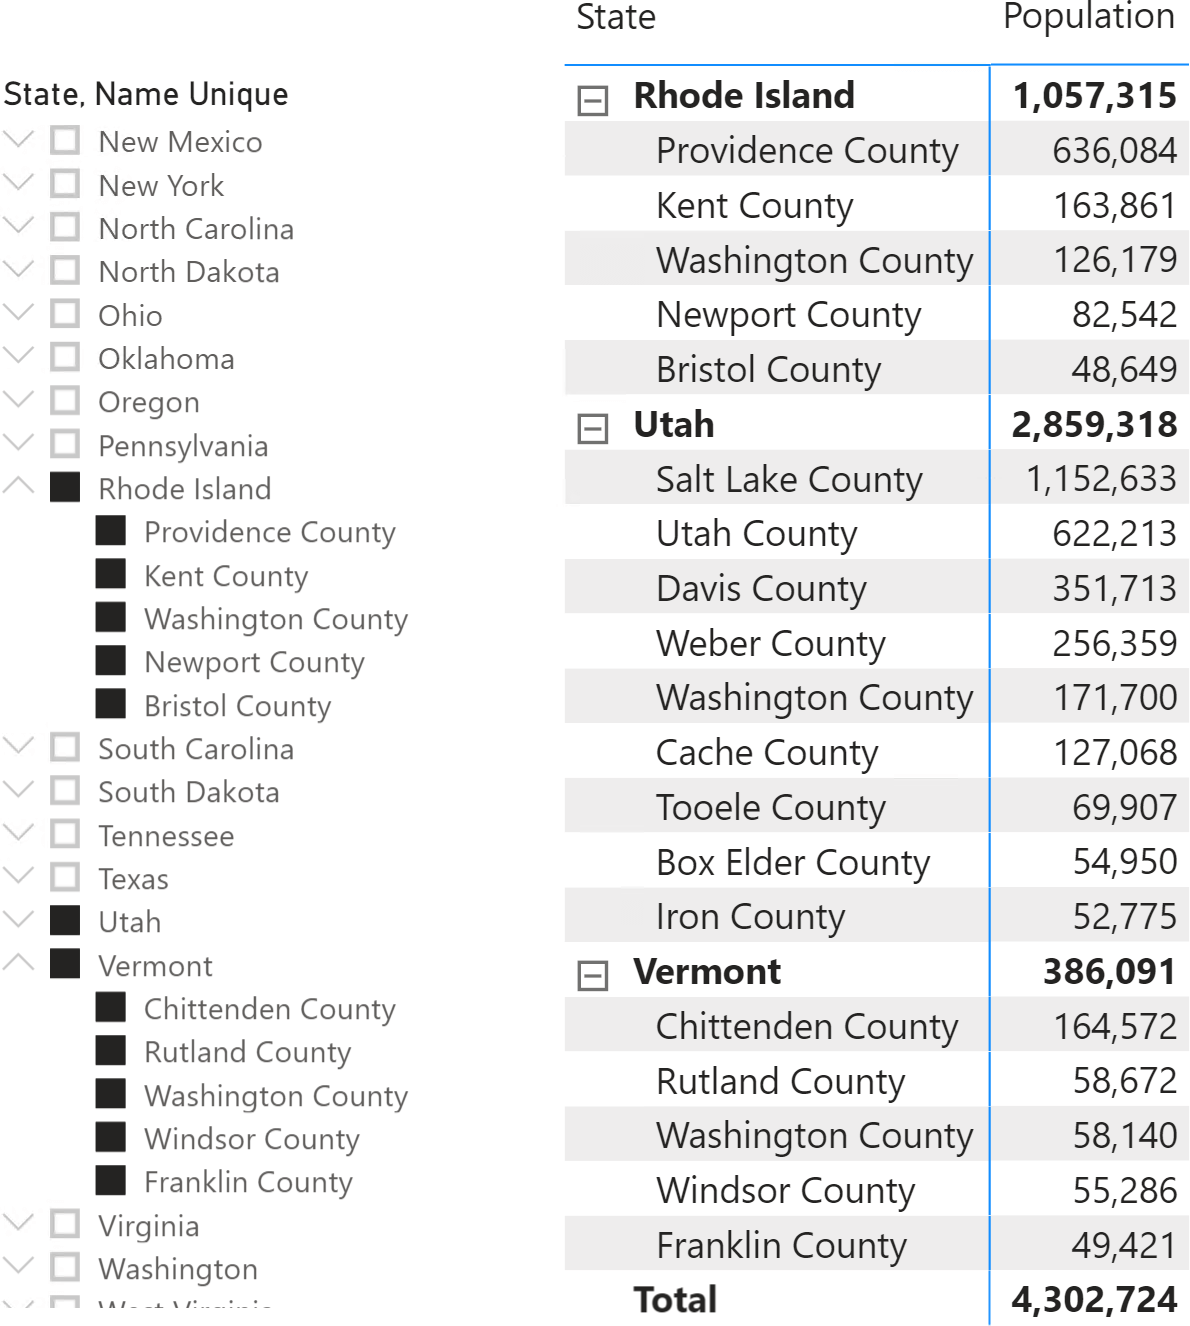
The slicer shows counties sorted by Population, even though Population is not part of the slicer itself. In the matrix, states are sorted alphabetically whereas counties are sorted by Population. If you look carefully, you should notice that Population does not sort the matrix which is using the default sorting.
Let us solve the first problem: we want a sort key that does not contain any duplicated value. By using a composite ranking of the population and the county key, we obtain a number that starts with 1 for the most populated county and increases by 1 for each county. In case there are ties in the population, the second key (the county key) ensure the result is unique. Because the RANKX function only accepts one expression for the ranking, we multiply the population by a factor large enough to hold the largest key:
Sort Key =
VAR NumberOfRows =
    COUNTROWS ( Census )
VAR CountyPopulation =
    SUMMARIZE (
        Census,
        Census[Key],
        Census[Population]
    )
VAR Result =
    RANKX (
        CountyPopulation,
        Census[Population] * NumberOfRows + Census[Key]
    )
RETURN
    Result
The Sort Key calculated column has a unique value for each county, which increases according to the corresponding Population value. Therefore, the report always sorts the counties by Population regardless of the data being sliced by State or not.
Once we have a sort key, we still cannot use the Sort by Column feature of the data model; indeed, several counties have the same name, like “Washington County”. We must make all the County names unique without changing how they are displayed. The Handling customers with the same name article describes how to accomplish this goal by adding zero-width spaces to the county name; this generates different county names for different states, even though the displayed county name is always the same – like “Washington County” in our example:
Name Unique =
VAR PlaceInSameState =
    CALCULATETABLE (
        SUMMARIZE ( Census, Census[Name], Census[Population] ),
        ALLEXCEPT ( Census, Census[Name] )
    )
VAR Ranking =
    RANKX ( PlaceInSameState, Census[Population] )
VAR Result =
    Census[Name]
        & REPT ( UNICHAR ( 8204 ), Ranking - 1 )
RETURN
    Result
At this point, we can sort the Census[Name Unique] column by using the Census[Sort Key] column: both columns have corresponding unique values in a one-to-one relationship.
The technique described in this article is compelling. Sorting columns the right way changes the usability of a model dramatically, letting users focus on the values that are most relevant to them. You can probably think of columns in your model that could be sorted in a non-trivial way. Categories, products, customers: all these entities could be sorted using values computed in columns, ranked, and then applied to the entity itself. We are not saying that the default alphabetical sorting is wrong. Just that sometimes you can turn your model into a more usable one by using more specific sorting techniques.
Returns the rank of an expression evaluated in the current context in the list of values for the expression evaluated for each row in the specified table.
RANKX ( <Table>, <Expression> [, <Value>] [, <Order>] [, <Ties>] )