 Marco Russo & Alberto Ferrari
In Power BI you can specify the unique identifier of a column value by using another column or another set of columns. This feature is currently used by the Fields Parameter feature in Power BI, but it may also be used for other purposes in a model. However, there are several limitations – such as the incompatibility with MDX queries – that reduce one’s ability to use Group By Columns property in many scenarios, so it cannot be used with Excel as a client.
Identifying unique business entities
The Group By Columns property was introduced many years ago in the Tabular model: it has been supported since compatibility level 1400 but only for Power BI, not for Analysis Services. You can find the documentation in the piece, RelatedColumnDetails class of TOM. There being a feature not supported in Analysis Services means that even though you can create a model with that property, you cannot deploy it to Analysis Services, neither on-premises nor on Azure. Therefore, we can consider this feature only for Power BI models at this time; we will update the article if and when the support is extended to Analysis Services.
The solution offered by Group By Columns is that it is now possible to define the identity of a column value by using other columns. For example, consider the customer name. There might be several customers with the same name, but it does not make sense to aggregate the revenues they represent as if they were one same customer. For example, consider the following report of customers whose name starts with “David H”.

Thanks to the Sales/Customer measure, we can immediately spot something strange. David Hall seems to be the customer with the largest Sales Amount in this group, but the fact that the average amount by customer (Sales/Customer) is smaller suggests that there are more customers with the same name! What is the Sales Amount of each David Hall? How can we show a report with one row for each customer named David Hall? One solution is to add the CustomerKey column to the report.

By using a Matrix visual in Power BI, we are forced to create two nested levels of aggregations: we can probably work on other visual properties to make the report look less weird, but the Matrix does not work well in this example. We can have a better result by using a Table visual.

Now we have the confirmation that there is one David Hall that has the largest Sales Amount in the report, but there are another two that have a low number for Sales Amount. We had to modify the visual, we cannot use the Matrix, and most importantly we might not be aware of the problem when creating a new report! A better solution would be a model that shows three different David Hall rows regardless of the choices made by the user, so that if the name is not enough to identify the customer, it will be up to the user to add columns in the report as required. We have two techniques available to us, to obtain that result.
Using Keep Unique Rows
Because CustomerKey is what guarantees that a customer name is unique, and CustomerKey is a primary key for the Customer table, we can use the Keep Unique Rows attribute of the Customer[Name] column to force Power BI to include the CustomerKey column every time it groups data by Customer[Name]. Although the CustomerKey is not displayed in the report, it is used in the underlying DAX query to group data.
There are two steps needed to obtain the desired behavior. The first step is to set CustomerKey as a key column of the Customer table. This can be done by using the diagram view in Power BI.

While it seems like we specified a table property, in reality in TOM we set the Key attribute of the CustomerKey column to True. Remember this difference if you prefer to use only Tabular Editor to perform these changes.

The second step requires Tabular Editor because we do not have a corresponding option in the Power BI user interface. Just to keep a single demo file, we duplicated the Name column into Name (Unique). We set the Keep Unique Rows of the Name (Unique) column to True: this way, any use of Name (Unique) in Power BI will always include also CustomerKey in the DAX query, even though CustomerKey is not visible in the report unless the user explicitly adds it.

Now the Matrix works as expected: by using the Name (unique) column, we see three rows for David Hall, because they are three different customers with different values for CustomerKey.

Unfortunately, these properties are ignored by MDX and by Excel. We just set model properties that do not have a direct effect on DAX: they simply “suggest” to a client that the query should include CustomerKey when Name (unique) is involved, but it is up to the client tool to respect that information and create a proper query and report. Thus, if we create a PivotTable in Excel by using Name (unique) and Sales Amount, we still get a single row for the three David Hall customers. In other words, both Name and Name (unique) produce the same inaccurate result in Excel.

This is probably the reason Microsoft does not expose the Keep Unique Rows property in Power BI. This approach also has another limitation: it only works when a column being unique, depends on the primary key of the entire table. While this works for the customer name, it might not work well for the city of the customer.
Using Group By Columns
To show how Group By Columns works, we create a report that shows the Sales Amount of the customers grouped by city, and we filter only the names that start with “Port”:

In this case, we are probably aware that there might be different cities with the same name in different countries and states. However, by default the report ignores this when grouping Sales Amount, and it shows a single row for Portland. By adding the Country and State columns, we can see that there are four Portland in the United States and one in Australia – not to mention the three Portsmouth in the United States! Note: there is no Portland city in Washington state as far as we know, so we have an example of bad data quality in Contoso.

In this case, we cannot use the Keep Unique Rows feature for two reasons: first, we cannot rely on CustomerKey, as we want to see one row grouping all the customer in the same city and not one row for each customer. Second, the combination of Country and State is what makes a city unique: the State column is not enough, because you might have the same city name in different countries that have no division in states. If we group Sales Amount only by City, we get only one Portland and one Portsmouth.

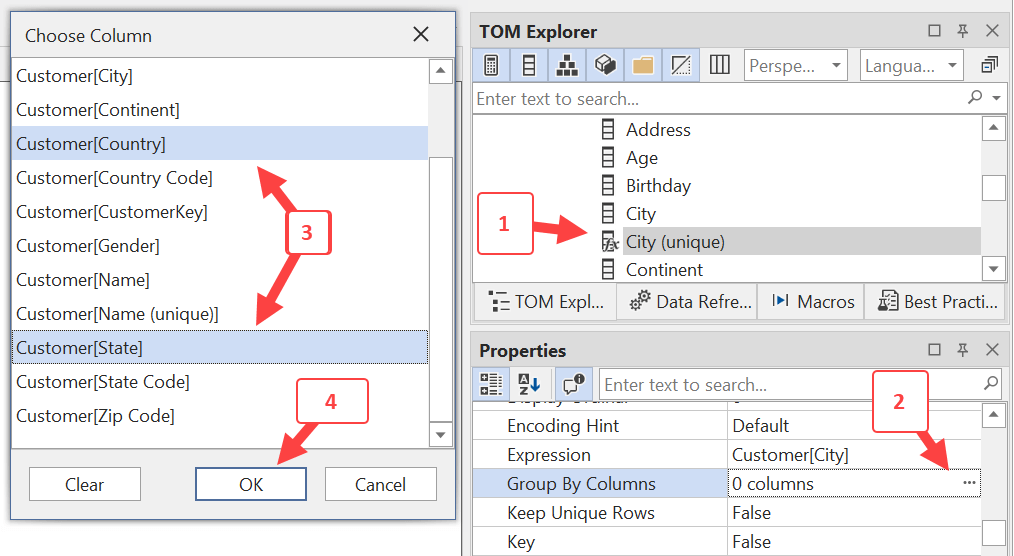
In order to keep a single demo file, we duplicated the City column into City (unique). We can say that the Customer[City (unique)] column must always be grouped by Customer[Country] and Customer[State] by using the Group By Columns property of Customer[City (unique)]. In Tabular Editor, select the column City (unique) (1) in the Customer table, select the button to open the Choose Column dialog box in the Group By Columns property (2), select both Customer[Country] and Customer[State] in the Choose Column dialog box (3) by holding down the CTRL key as you click the two columns, and click OK (4) to close the Choose Column dialog box.
WARNING: this example is not a best practice. As described later, the Group By Columns property should also include the City column, but for the purpose of this explanation, we are skipping this step for now. Read the article until the end to understand why you should also include City in the Group By Columns attribute for the City (unique) column.
After you save the changes to Power BI, the report by City (unique) shows the right number of cities: five rows for Portland and three rows for Portsmouth.

What about Excel? Still no luck, but this time an error is what tells us it is not working, rather than results being inaccurate or misleading.

The error message is: Column [City (unique)] is part of composite key, but not all columns of the composite key are included in the expression or its dependent expression.
There is a saying that an error is better than wrong data in a report: the former makes users angry, while the latter could get you fired! Excel chooses the safe route of stopping users from looking at wrong data, which is good – this was not happening with the Keep Unique Rows property.
By including both Country and State in the report, then you can also use City (unique) in a PivotTable.

The output produced by Excel teaches us how Group By Columns works internally. The additional metadata that Group By Columns provides to the client tool is not the only effect of this setting. The columns specified in Group By Columns must be present in the grouping conditions of any query that includes the target column – City (unique) in this case – otherwise, the query fails with an error. The error we see in Excel when Country and State are not included in the MDX query generated by the PivotTable is the same error that would be produced by a DAX query that misses one of those columns. We do not see this error happening in Power BI because Power BI takes care of adding the columns to the DAX query.
Understanding Group By Columns from a DAX perspective
The Group By Columns property says: never group by this column without also grouping by these other columns. In the previous example, this means that in order to group by City (unique), a query must also group by Country and State. If Country or State are missing from the group by condition of a query, then the query cannot be executed, and you get an error. This constraint is applied to both DAX and MDX. Power BI takes into account the presence of the Group By Columns setting when it generates the query, so the user does not see what happens under the cover – whereas Excel does not support this property and does not add additional columns to the MDX query for a PivotTable, so it returns an error if the user does not include the required columns in the report.
Let us see how Power BI uses this information in the previous report where we only displayed the Sales Amount by City (unique).

The DAX query generated for the report in this latter picture contains Customer[State] and Customer[Country] in all the functions that participate in the groupby condition: not only SUMMARIZECOLUMNS, but also TOPN! The query returns all the columns to Power BI, which also uses the sort order of cities with the same name in a deterministic way thanks to the ORDER BY condition:
DEFINE
    VAR __DS0FilterTable = // filter only three city names
    VAR __DS0Core =
        SUMMARIZECOLUMNS (
            'Customer'[State],
            'Customer'[Country],
            'Customer'[City (unique)],
            __DS0FilterTable,
            "Sales_Amount", 'Sales'[Sales Amount]
        )
    VAR __DS0PrimaryWindowed =
        TOPN (
            502,
            __DS0Core,
            'Customer'[City (unique)], 1,
            'Customer'[State], 1,
            'Customer'[Country], 1
        )

EVALUATE
__DS0PrimaryWindowed
ORDER BY
    'Customer'[City (unique)],
    'Customer'[State],
    'Customer'[Country]
What happens if we try to use City (unique) without State or Country? Because Power BI adds those columns for us, we can try in DAX Studio first. And the first surprise is that ALL works!
--
-- Each of the following queries works
--
EVALUATE
ALL ( 'Customer'[City (unique)] )

EVALUATE
ALLNOBLANKROW ( 'Customer'[City (unique)] )
As soon as we try to consider the filter context or to group data, DAX does not run the query: SUMMARIZE, SUMMARIZECOLUMNS, DISTINCT, and VALUES are all going to fail when we specify only City (unique):
--
-- Each of the following queries fails
-- with the following error:
--
-- Column [City (unique)] is part of composite key,
-- but not all columns of the composite key are included
-- in the expression or its dependent expression.
--
EVALUATE
SUMMARIZE ( 'Customer', 'Customer'[City (unique)] )

EVALUATE
SUMMARIZECOLUMNS ( 'Customer'[City (unique)] )

EVALUATE
DISTINCT ( 'Customer'[City (unique)] )

EVALUATE
VALUES ( 'Customer'[City (unique)] )

EVALUATE
ADDCOLUMNS ( ALL ( 'Customer'[City (unique)] ), "Sales", [Sales Amount] )
The context transition too should include the three columns: indeed, trying to work around the limitations by using ADDCOLUMNS over ALL does not work, as shown in the last example of the previous code snippet. The limitations extend to the possibility to group or filter data by City (unique). This is because neither TREATAS nor a CALCULATE filter condition can specify City (unique) without also specifying Country and State:
--
-- Each of the following queries fails
-- with the following error:
--
-- Column [City (unique)] is part of composite key,
-- but not all columns of the composite key are included
-- in the expression or its dependent expression.
--
EVALUATE
TREATAS ( { "Portland" }, Customer[City (unique)] )

EVALUATE
{
    CALCULATE (
        [Sales Amount],
        Customer[City (unique)] = "Portland"
    )
}
The issue with the DAX syntax is that the three columns City (unique), Country, and State must be part of the same table. Remember, a filter is a table, so three separate filters are three separate tables and one of them has City (unique) as its only column – so the following query does not work!
--
-- The following query fails
-- with the following error:
--
-- Column [City (unique)] is part of composite key,
-- but not all columns of the composite key are included
-- in the expression or its dependent expression.
--
EVALUATE
{
    CALCULATE (
        [Sales Amount],
        Customer[City (unique)] = "Portland",
        Customer[State] = "Oregon",
        Customer[Country] = "United States"
    )
}
The easiest way to get a filter for Portland, OR is the following TREATAS:
--
-- Each of the following queries works
--
EVALUATE
TREATAS (
    { ( "Portland", "Oregon", "United States" ) },
    Customer[City (unique)],
    Customer[State],
    Customer[Country]
)

EVALUATE
{
    CALCULATE (
        [Sales Amount],
        TREATAS (
            { ( "Portland", "Oregon", "United States" ) },
            Customer[City (unique)],
            Customer[State],
            Customer[Country]
        )
    )
}
We have shown a relatively small number of examples. Remember that the same restrictions apply to any other DAX function that internally uses one of the syntaxes that are not allowed by Group By Columns, such as HASONEVALUE and SELECTEDVALUE. For example, instead of using:
SELECTEDVALUE ( Customer[City (unique)] )
We can write:
VAR __SelectedValue =
    SELECTCOLUMNS (
        SUMMARIZE (
            Customer,
            Customer[City (unique)],
            Customer[State],
            Customer[Country]
        ),
        Customer[City (unique)]
    )
RETURN
    IF (
        COUNTROWS ( __SelectedValue ) = 1,
        __SelectedValue
    )
You can find other considerations about SELECTEDVALUE and HASONEVALUE in the Using SELECTEDVALUE with Fields Parameters in Power BI blog post. Besides the engine constraints that the Group By Columns attribute creates, it is helpful to deeply understand how Power BI uses this information to build the DAX query.
Understanding Group By Columns from a Power BI perspective
We have already seen that when the Group By Columns attribute is specified, Power BI generates queries including all the group by columns as grouping and sorting conditions. However, there is another side effect related to the use of filters and slicers, and we will discover that the assumption made by Power BI is slightly different from the assumption made by DAX. This is why you should complete the reading of the article before deciding if, when, and how to use the Group By Columns property in your model.
We start with a page filter where we selected two out of the five Portland cities available in the City (unique) column – remember, at this point the Group By Columns include Country and State.

The filter generated in the DAX query includes only the columns used in the Group By Columns attribute:
DEFINE
    VAR __DS0FilterTable =
        TREATAS (
            {
                ( "Maine", "United States" ),
                ( "New South Wales", "Australia" )
            },
            'Customer'[State],
            'Customer'[Country]
        )
How is this supposed to work? Where is the filter on Portland as a city? Indeed, there is no such filter, and the result is that we see all the cities in Maine, USA, and New South Wales, Australia.

We are not completely sure whether this was by design or not, but clearly Power BI uses the Group By Columns as a set of columns that uniquely identify the value displayed in the selected column. There are pros and cons to this. The negative aspect is that we do not have the exact semantics of Group By Columns that we have seen in DAX. From a DAX standpoint, Group By Columns specifies a constraint for additional columns that have to be included when a column is grouped, whereas in Power BI the same attribute specifies a composite key that uniquely identifies a column value. Thus, the solution is to add Customer[City] to the Group By Columns property of the City (unique) column.

The DAX query that implements the page filter now includes the city name:
DEFINE
    VAR __DS0FilterTable =
        TREATAS (
            {
                ( "Portland", "Maine", "United States" ),
                ( "Portland", "New South Wales", "Australia" ),
                ( "Portland", "Oregon", "United States" )
            },
            'Customer'[City],
            'Customer'[State],
            'Customer'[Country]
        )
We have seen the DAX code produced by a page filter, but we can observe the same behavior for any other filter or slicer in a Power BI report.
This behavior is not so intuitive. However, the good news is that we can leverage this behavior to store a filter by using an alternate value, which represents the key of the entity. For example, in the Product table we assigned the Category Code column to the Group By Columns property for Category.

Similarly, we assigned Subcategory Code to Subcategory and Product Code to Product Name. We create a report with a slicer on Category when we select Audio and Music, and a matrix with Sales Amount grouped by Subcategory.

A simplified version of the DAX query generated to populate the matrix unveils an interesting behavior.
DEFINE
    VAR __DS0FilterTable =
        TREATAS (
            {
                "06",
                "01"
            },
            'Product'[Category Code]
        )

EVALUATE
SUMMARIZECOLUMNS (
    'Product'[Subcategory Code],
    'Product'[Subcategory],
    __DS0FilterTable,
    "Sales_Amount", 'Sales'[Sales Amount]
)
ORDER BY
    'Product'[Subcategory Code],
    'Product'[Subcategory]
The filter applied to the Category slicer (lines 4-8) includes only the corresponding values in Category Code. The SUMMARIZECOLUMNS function groups by both Subcategory and Subcategory Code (lines 13-14), even though only Subcategory is displayed. Finally, the Subcategory name is sorted by Subcategory Code also in the visual because of the ORDER BY clause (lines 19-20). Indeed, Bluetooth Headphones (the subcategory code is 0106) is after Recording Pen (code 0104).
The values selected in filters and slicers are stored by Power BI using the same values as those used in the DAX code. Therefore, if we save the last report, the values stored for Category are the codes 01 and 06. If we open the report one month later and the category names have been renamed or translated, the selection will still use the codes 01 and 06, retrieving whatever values correspond to those codes when the user runs the report.
The behavior of Group By Columns can be confusing if you do not realize that the assumptions made by DAX and Power BI are different. However, when you want to select and display a value assuming that its code is important and not its description, then Group By Columns is a feature that produces the desired effect in Power BI. This behavior is not completely consistent with Excel, even though Group By Columns does not show misleading values as Keep unique Rows does in Excel. Group By Columns is a property used internally by the Fields Parameters feature in Power BI, which is not compatible with Excel clients.
Finally, consider that because the DAX filter is applied to the key column, if you use ISFILTERED, the column to check is the column specified in Group By Columns and not the column shown in the slicer. Indeed, the latter is not present at all in the DAX query for the matrix that we analyzed.
Conclusions
You can use Group By Columns in your model only if you understand how it works internally and if you accept its limitations for Excel. Group By Columns in Power BI defines an composite key for an entity. This composite key is stored for the filter selection instead of the displayed value – for both filters and slicers in Power BI. Usually, this key is made up of a single column as is the case for the table created for Fields Parameters in Power BI.
Using the Group By Columns property comes with side effects to DAX that you must consider when you author measures. Indeed, you want to think about the constraints generated by the attribute (including all the grouping columns) and about the assumptions made by Power BI: filters and slicers only produce filters for the Group By Columns and not for the original column displayed in the report.
Create a summary table for the requested totals over set of groups.
SUMMARIZECOLUMNS ( [<GroupBy_ColumnName> [, [<FilterTable>] [, [<Name>] [, [<Expression>] [, <GroupBy_ColumnName> [, [<FilterTable>] [, [<Name>] [, [<Expression>] [, … ] ] ] ] ] ] ] ] ] )
Returns a given number of top rows according to a specified expression.
TOPN ( <N_Value>, <Table> [, <OrderBy_Expression> [, [<Order>] [, <OrderBy_Expression> [, [<Order>] [, … ] ] ] ] ] )
Returns all the rows in a table, or all the values in a column, ignoring any filters that might have been applied.
ALL ( [<TableNameOrColumnName>] [, <ColumnName> [, <ColumnName> [, … ] ] ] )
Creates a summary of the input table grouped by the specified columns.
SUMMARIZE ( <Table> [, <GroupBy_ColumnName> [, [<Name>] [, [<Expression>] [, <GroupBy_ColumnName> [, [<Name>] [, [<Expression>] [, … ] ] ] ] ] ] ] )
Returns a one column table that contains the distinct (unique) values in a column, for a column argument. Or multiple columns with distinct (unique) combination of values, for a table expression argument.
DISTINCT ( <ColumnNameOrTableExpr> )
When a column name is given, returns a single-column table of unique values. When a table name is given, returns a table with the same columns and all the rows of the table (including duplicates) with the additional blank row caused by an invalid relationship if present.
VALUES ( <TableNameOrColumnName> )
Returns a table with new columns specified by the DAX expressions.
ADDCOLUMNS ( <Table>, <Name>, <Expression> [, <Name>, <Expression> [, … ] ] )
Treats the columns of the input table as columns from other tables.For each column, filters out any values that are not present in its respective output column.
TREATAS ( <Expression>, <ColumnName> [, <ColumnName> [, … ] ] )
Evaluates an expression in a context modified by filters.
CALCULATE ( <Expression> [, <Filter> [, <Filter> [, … ] ] ] )
Returns TRUE if any of the arguments are TRUE, and returns FALSE if all arguments are FALSE.
OR ( <Logical1>, <Logical2> )
Returns true when there’s only one value in the specified column.
HASONEVALUE ( <ColumnName> )
Returns the value when there’s only one value in the specified column, otherwise returns the alternate result.
SELECTEDVALUE ( <ColumnName> [, <AlternateResult>] )
Returns true when there are direct filters on the specified column.
ISFILTERED ( <TableNameOrColumnName> )