 Marco Russo
Power Settings
The first and most important settings to check is the Power Settings. You have to make sure you disable any power saving or low power mode of your hardware. The impact of this setting is huge. I have seen too many times that the performance were affected in a negative way because of this setting, because VertiPaq (the internal engine of Analysis Services Tabular) uses the CPU available for a small amount of time, and the latency that increases the CPU speed is too large for the timings involved in VertiPaq operations.
You might think that this setting is not important, but the reality is that it is more important than the others described in this article. I observed the negative effects of this setting also in virtual machines. A common mistake is to consider that who installed the hardware configured this setting in a proper way. The reality is that too many times the default setting is a “power saving mode” that nobody modifies after the setup. In certain servers, you have to modify BIOS settings and restart the server, but in hardware that enables remote management, you can change this settings online. For example, in an HP blade you might have a similar remote management interface.
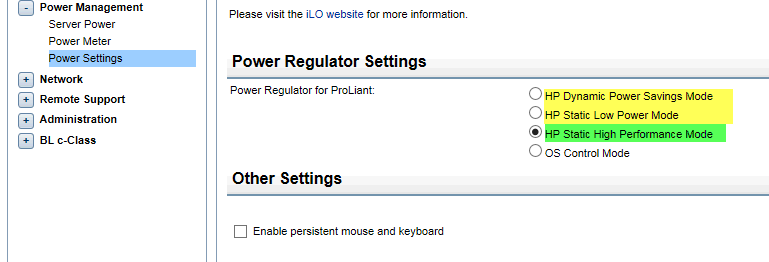
The correct setting is highlighted in green (HP Static High Performance Mode). Settings in yellow should be avoided for Analysis Services Tabular. You have to check similar settings in your hardware. For example, a server that had the “Dynamic Power Savings Mode” cut execution times of several benchmarks between 13% and 50%. It is hard to predict which type of queries get more benefits, because there are heavy queries running on formula engine for several seconds that saved between 14% and 49% of execution time. In any case, the negative impact of a power saving setting can double the waiting time of a query. Especially for small databases, this is the most important setting to verify.
When I execute a performance assessment, I always ask the configuration, and I validate the benchmark of the CPU with the technical specs. When I see numbers that do not match, this is always the first check to do.
NUMA Architecture and Affinity Mask
If you have a server with two or more sockets, you might encounters performance bottleneck caused by NUMA architecture. Analysis Services Tabular 2012/2014 is not NUMA aware, and we do not have news about 2016 version at the moment of writing. Therefore, you should run an instance of Analysis Services Tabular on cores that runs on a single socket.
If you run Analysis Services Tabular on a physical server, you should follow instructions described in Forcing NUMA Node affinity for Analysis Services Tabular databases.
If you run Analysis Services Tabular in a virtual machine, you have to make sure that the virtual machine runs on cores of the same socket, and provide to the virtual machine a single CPU with an equivalent number of cores. You should not assign more cores than the ones available in a single socket. You also have to associate memory allocation with a NUMA Node using memory affinity, if your hypervisor allows such a setting. User interface for this is different between Hyper-V and VMWare.
The impact of NUMA setting can vary, the typical saving for this is between 1% and 25%. Impact can be higher on very large database under a heavy workload (multiple concurrent requests).
Hyperthreading
Despite the many articles that suggests disable hyper-threading for maximum performance, the reality is that many benchmark I run provided better performance with hyper-threading enabled, whereas other benchmarks provided a penalty between 1% and 8%. Not having a clear case for that, I usually keep hyper threading enabled. You should do a specific benchmark on your database and hardware before disabling it, and I would keep it disabled only if the performance advantage is greater than 10% in most of the situations.
Virtualization
Running Analysis Services Tabular in a virtualized server is not an issue by itself. The performance penalty of running in a virtual machine is between 1% and 3% in most of the ideal conditions. However, you have to make sure that:
- You do not overcommit memory on the host server
- Possibly, you commit the memory to the virtual machine (so it is never paged)
- You do not allocate more cores on a virtual server than the ones available in a single socket
- You allocate only cores from a single NUMA node (single socket)
- You set affinity mask for the cores running on the same NUMA node (single socket)
- You set memory affinity for NUMA node
Conclusion
In my experience, there are a lot of discussion about topics (such as Hyperthreading) that have a relative impact on performance, whereas other settings are more frequent causes for slow and unpredictable response times of DAX queries. I hope this short article will help in identifying these problems earlier.