 Marco Russo & Alberto Ferrari
In a previous article, Rolling 12 Months Average in DAX we showed you how to compute a rolling average over a time period. In this new article, we want to take you one step further and show how to compute a moving average over a certain timeframe, that takes into account only the working days. We present two variations of the same solution: one that is optimized, relying on a calculated column, and one that – despite being somewhat slower – works without requiring a calculated column. The latter can be useful in case you need to define the formula in a live-connected report, where calculated columns are not an option.
Because the formula needs to account for working versus non-working days, it cannot rely on standard time intelligence functions. Indeed, DAX time intelligence functions have no knowledge about what it means for a day to be either a working day or a rest day. The NETWORKDAYS DAX function would not be very useful in this case, because it would introduce a slow filter to compute the range of dates that includes the number of working days desired.
The first ingredient needed to perform the calculation is the information about whether a day is a rest day or not. The perfect place where to store that information is a Boolean column in the Date table, containing TRUE or FALSE. TRUE for working days, FALSE for rest days. In our demo model, the column is named Working Day.
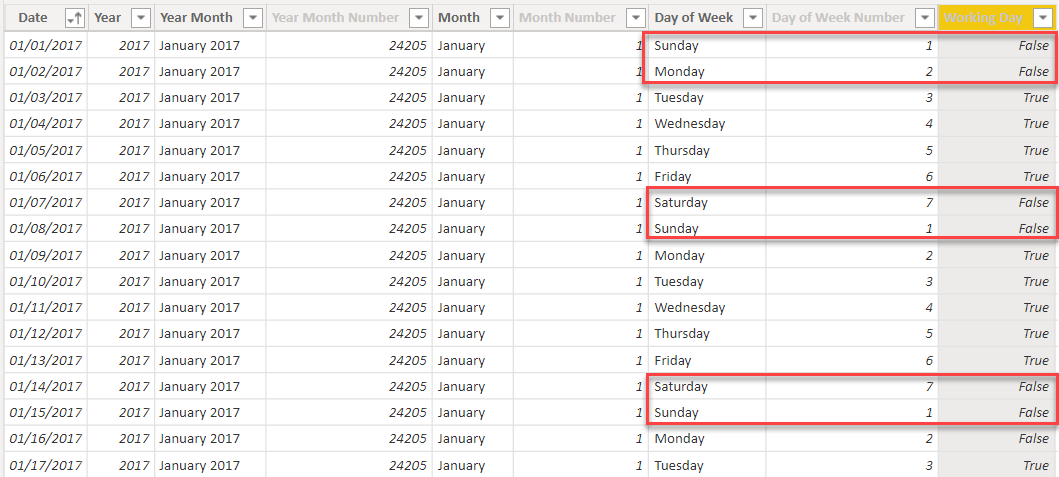
Given a specific date, our formula will need to determine the date N working days before that specific date. For example, if we take Monday, January 11th and we want to compute a rolling average over five working days, we need to go back to January 5th. Indeed, the range between January 5th and 11th includes seven days, only five of which are working days.
The easiest way to compute the first date of the required range is to create a new column, in Date, containing a sequential working day number. It needs to be a number that increases by one on each working day, and that does not increase during holidays. There are multiple ways to author this code. A good option is to rely on the RANKX function and rank each working day by Date[Date] ascending. We want the working day of Saturdays and Sundays to be the same as the Friday before. In general, a non-working day must show the same working day number as the previous working day. To obtain this goal, we subtract one from the ranking in case the current date is not a working day:
1 2 3 4 5 6 7 8 9 10 | Working Day Number =RANKX ( FILTER ( 'Date', 'Date'[Working Day] ), 'Date'[Date], , ASC) - NOT 'Date'[Working Day] |
 Copy
Copy Conventions
You might notice that we are subtracting a Boolean condition (NOT ‘Date'[Working Day]) from an integer value (the result of RANKX). This code is not extremely readable, and it relies on the equivalence of TRUE being stored as one while FALSE is stored as zero. Despite not being readable, the code is optimized. This detail is not relevant for now; it will be useful in a later version of the formula.
The Working Day Number column, once computed, shows a number that increases only on working days.
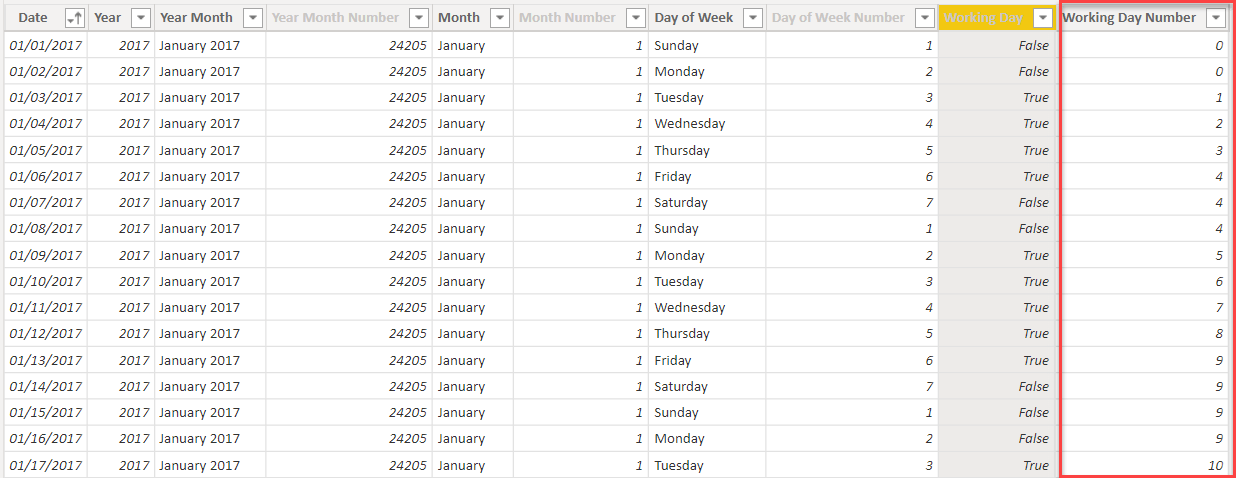
This column is useful because it lets us compute the lower boundary of the range with a simple subtraction. For example, to find the lower boundary to use for a five-day rolling average that ends on January the 11th, we proceed as follows:
- subtract four (5-1) from the Working Day Number. The working day number of the 11th of January is 7; we obtain a working day number of three (7-4).
- search for the date whose value for WorkingDayNumber is three. It is reasonably easy to spot that the date to use for the lower boundary is January 5th.
Once the column is in place, the model is ready for the formula that computes the rolling average. The formula is quite complex, because it needs to take into account several small details. Therefore, we broke it down into steps that add one layer of complexity at a time. The final calculation will be a rolling average over the last 30 working days.
The first version, which still displays several issues, is the following:
1 2 3 4 5 6 7 8 9 10 11 12 13 14 15 16 17 18 19 20 21 22 | Rolling 30WD (1) =VAR NumberOfDays = 30VAR MaxWorkingDay = MAX ( 'Date'[Working Day Number] )VAR MinWorkingDay = MaxWorkingDay - ( NumberOfDays - 1 )VAR DatesToUse = FILTER ( ALL ( 'Date' ), AND ( 'Date'[Working Day Number] <= MaxWorkingDay, 'Date'[Working Day Number] >= MinWorkingDay ) )VAR Result = CALCULATE ( DIVIDE ( [Sales Amount], NumberOfDays ), DatesToUse )RETURN Result |
Despite being somewhat long, the formula is straightforward: it computes the boundaries of the range using the Date[Working Day Number] column, then it uses the boundaries to define a set of dates, which is finally used in CALCULATE as a filter to compute Sales Amount in the required range divided by the number of days.
When used in a report, we see the weakness of the formula immediately. The table below shows this quite clearly.
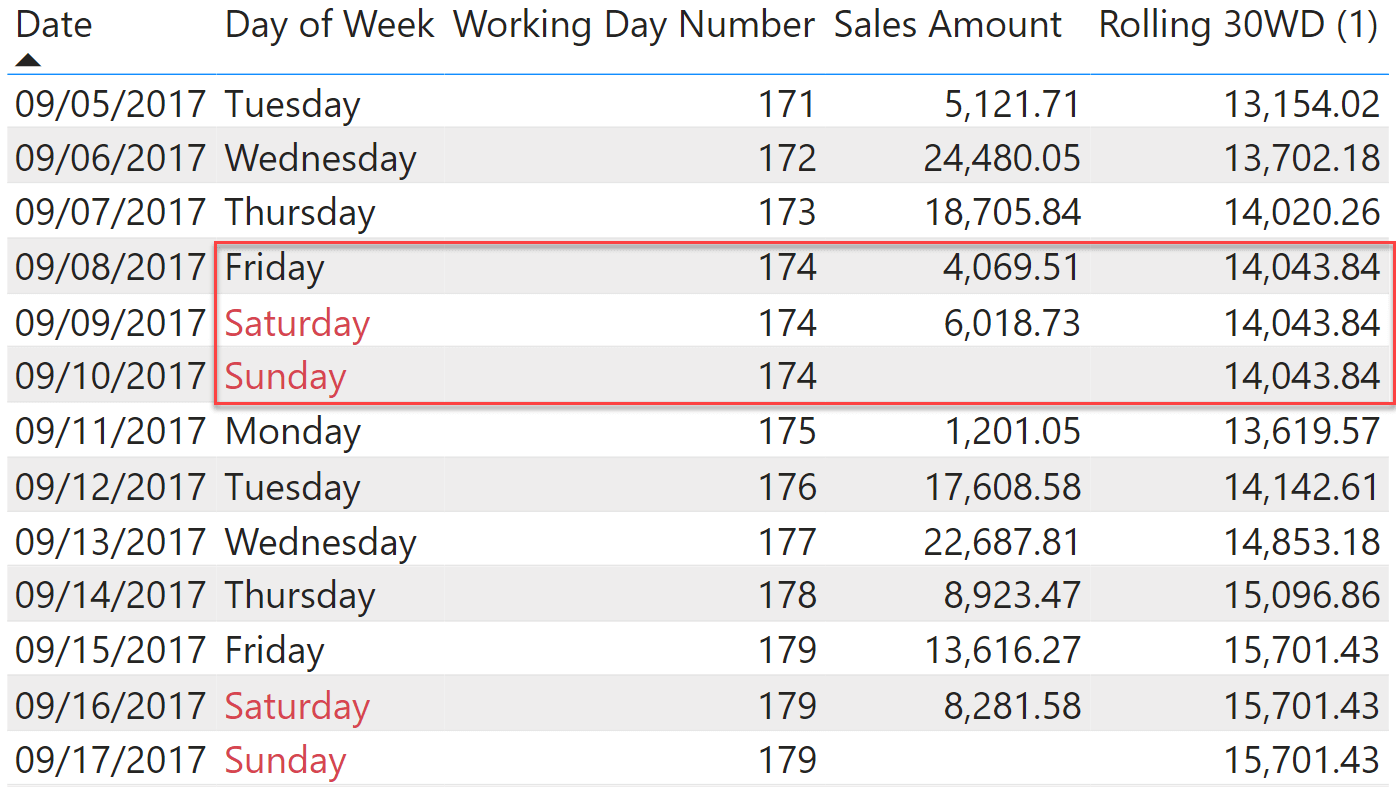
The value on Friday, Saturday and Sunday is the same. That would be correct if we did not have sales on that Saturday. Nonetheless, because there are sales on that Saturday, the rolling average should be different between Friday and Saturday. Here, the problem is that because Friday, Saturday and Sunday all share the same Working Day Number, a filter that only takes into account the Working Day Number column would return the same value for all three days.
When computing the value for Friday, we do not want to include the sales on Saturday. Similary, if there were sales on Sunday, we would not want to include them in the value for Saturday. Therefore, we need to change the condition to limit the upper boundary not on the Working Day Number but rather on the Date. In other words, on Friday, September 8th we will not see 174 as the upper boundary, but rather the date (September 8th).
The second version of the code is the following:
1 2 3 4 5 6 7 8 9 10 11 12 13 14 15 16 17 18 19 20 | Rolling 30WD (2) =VAR NumberOfDays = 30VAR MaxWorkingDay = MAX ( 'Date'[Working Day Number] )VAR MaxDate = MAX ( 'Date'[Date] )VAR MinWorkingDay = MaxWorkingDay - ( NumberOfDays - 1 )VAR DatesToUse = FILTER ( ALL ( 'Date' ), AND ( 'Date'[Date] <= MaxDate, 'Date'[Working Day Number] >= MinWorkingDay ) )VAR Result = CALCULATE ( DIVIDE ( [Sales Amount], NumberOfDays ), DatesToUse )RETURN Result |
If we look at the two measures side-by-side, you can appreciate the difference between Friday and Saturday. As expected, Saturday and Sunday return the same value.
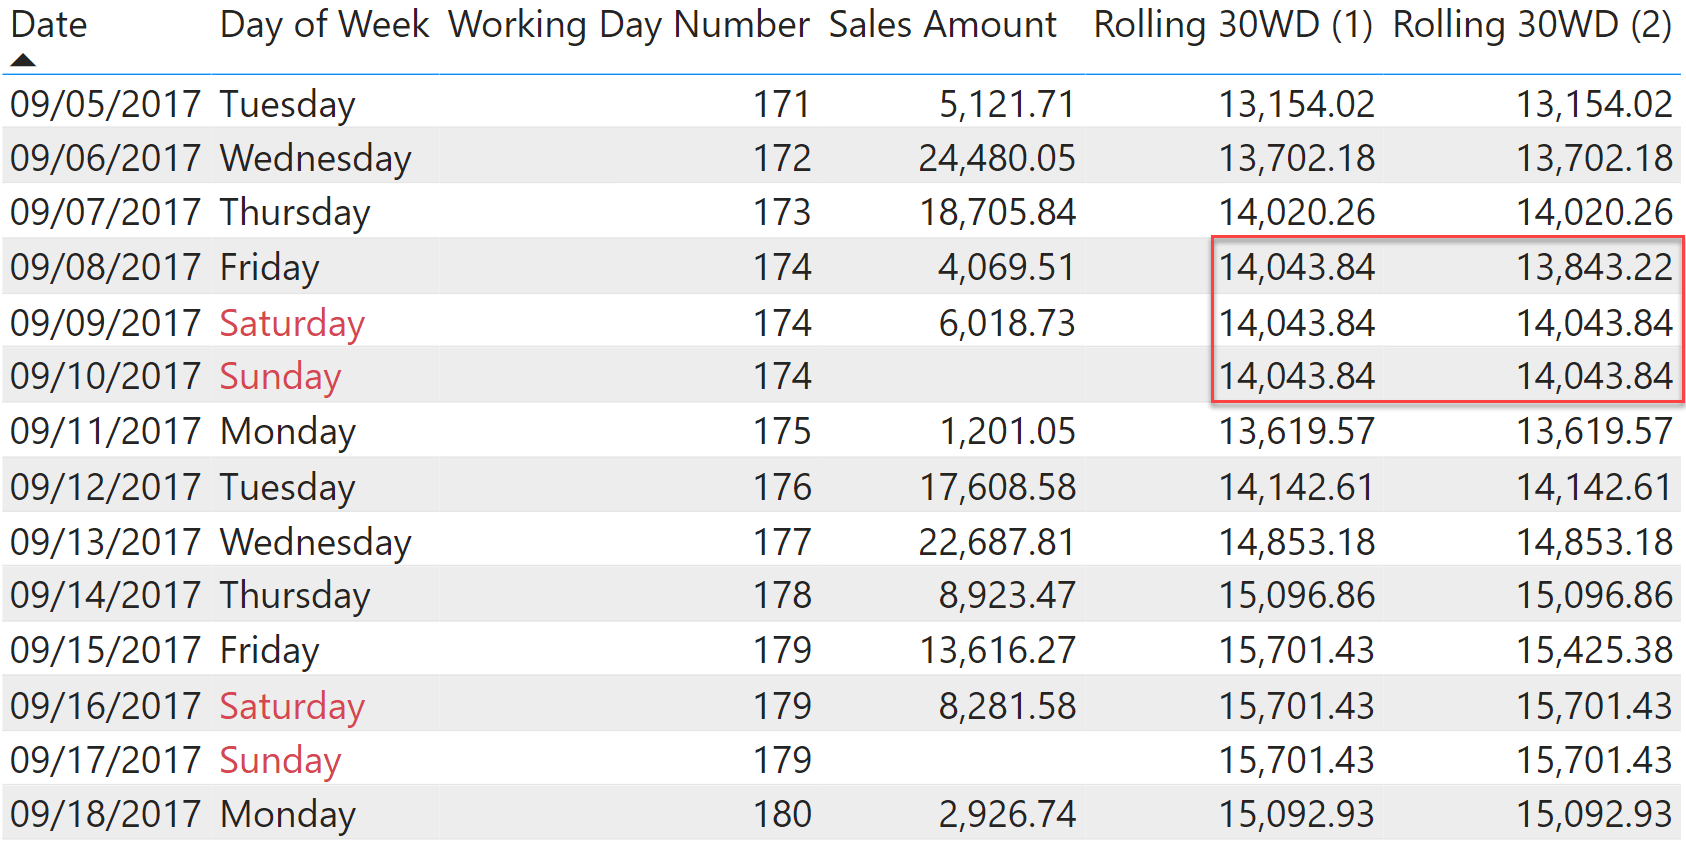
Despite being better, this formula is still problematic: it computes values for the future. Because it is a rolling average, its value slowly decreases after the last date with sales until eventually becomes zero. We can easily see this by using a chart that shows Sales Amount and its rolling average on the same line chart.

In order to avoid showing information that is not useful, we need to blank the measure after the last date with sales. This drives us to the final formulation of the measure:
1 2 3 4 5 6 7 8 9 10 11 12 13 14 15 16 17 18 19 20 21 | Rolling 30WD =VAR MaxDateEver = CALCULATE ( MAX ( Sales[Order Date] ), REMOVEFILTERS () )VAR NumberOfDays = 30VAR MaxWorkingDay = MAX ( 'Date'[Working Day Number] )VAR MaxDate = MAX ( 'Date'[Date] )VAR MinWorkingDay = MaxWorkingDay - ( NumberOfDays - 1 )VAR DatesToUse = FILTER ( ALL ( 'Date' ), AND ( 'Date'[Date] <= MaxDate, 'Date'[Working Day Number] >= MinWorkingDay ) )VAR Result = CALCULATE ( DIVIDE ( [Sales Amount], NumberOfDays ), DatesToUse )RETURN IF ( MaxDate <= MaxDateEver, Result ) |
This last version of the code works smoothly, and it takes care of all the details. The only shortcoming of this formula is that it relies on a calculated column: Date[Working Day Number]. If you wanted to create the calculation on a live-connected report, you would be in trouble. Indeed, calculated columns are not available in live-connected models.
In a live-connected model you can only author measures. Therefore, we need to replicate the entire logic using a measure. We need to create the equivalent of the calculated column in a variable, and then use the variable to define the range. The formula is very similar to the previous one, with the addition of an initial Dates variable containing the @Working Day Number column required for the calculation:
1 2 3 4 5 6 7 8 9 10 11 12 13 14 15 16 17 18 19 20 21 22 23 24 25 26 27 28 29 30 31 32 33 34 | Rolling 30WD Live =VAR Dates = ADDCOLUMNS ( ALL ( 'Date'[Date], 'Date'[Working Day] ), "@Working Day Number", RANKX ( FILTER ( ALL ( 'Date' ), 'Date'[Working Day] ), 'Date'[Date], , ASC ) - NOT 'Date'[Working Day] )VAR NumberOfDays = 30VAR MaxDate = MAX ( 'Date'[Date] )VAR MaxWorkingDay = MAXX ( FILTER ( Dates, 'Date'[Date] <= MaxDate ), [@Working Day Number] )VAR MinWorkingDay = MaxWorkingDay - ( NumberOfDays - 1 )VAR MaxDateEver = CALCULATE ( MAX ( Sales[Order Date] ), REMOVEFILTERS() )VAR DatesToUse = FILTER ( Dates, [@Working Day Number] >= MinWorkingDay && 'Date'[Date] <= MaxDate )VAR Result = DIVIDE ( CALCULATE ( [Sales Amount], DatesToUse, REMOVEFILTERS ( 'Date' ) ), NumberOfDays )RETURN IF ( MaxDate <= MaxDateEver, Result ) |
There is no need to comment on the Dates variable, because it uses the code we used in the calculated column – albeit this time in a temporary column added by ADDCOLUMNS instead of a physical calculated column stored in the table.
Naturally, this formula is slower than the version that relies on the calculated column. Yet, it is totally acceptable because it depends on the number of rows in the Date table. Date is seldom a very large table, hence the decrease in performance is not excessive. With that said, if you have the option of creating a calculated column, you will for sure obtain a faster solution.
Conclusions
As you have seen, the power of DAX is in having the option of combining different base functions to build your own calculations. Even though there is no predefined function to compute a rolling average over working days, once you learn how to mix basic DAX functions together, you can solve the problem. Then, as always you need to handle special cases. Here, that would be having sales on non-working days and clearing the value of the measure for the future.
Remember: the best DAX developers are not the ones who know each and every DAX function by heart. The best DAX developers are those who spent time learning the theory and the overall logic of functional programming, of row context, filter context and table functions, and who know how to combine basic functions into complex logic.
Returns the number of whole workdays between two dates (inclusive) using parameters to indicate which and how many days are weekend days. Weekend days and any days that are specified as holidays are not considered as workdays.
NETWORKDAYS ( <start_date>, <end_date> [, <weekend>] [, <holidays>] )
Returns the rank of an expression evaluated in the current context in the list of values for the expression evaluated for each row in the specified table.
RANKX ( <Table>, <Expression> [, <Value>] [, <Order>] [, <Ties>] )
Evaluates an expression in a context modified by filters.
CALCULATE ( <Expression> [, <Filter> [, <Filter> [, … ] ] ] )
Returns a table with new columns specified by the DAX expressions.
ADDCOLUMNS ( <Table>, <Name>, <Expression> [, <Name>, <Expression> [, … ] ] )