 Marco Russo & Alberto Ferrari
In a previous article, we introduced VISUAL SHAPE, the table modifier that adds a hierarchical structure to a table, which is needed to implement visual calculations. In this article, we introduce the concept of visual context, the virtual table lattice, and the two main operators to navigate in the visual context: EXPAND and COLLAPSE.
Find more in the Understanding Visual Calculations in DAX whitepaper available to SQLBI+ subscribers
Navigating the lattice of the virtual table with the visual context
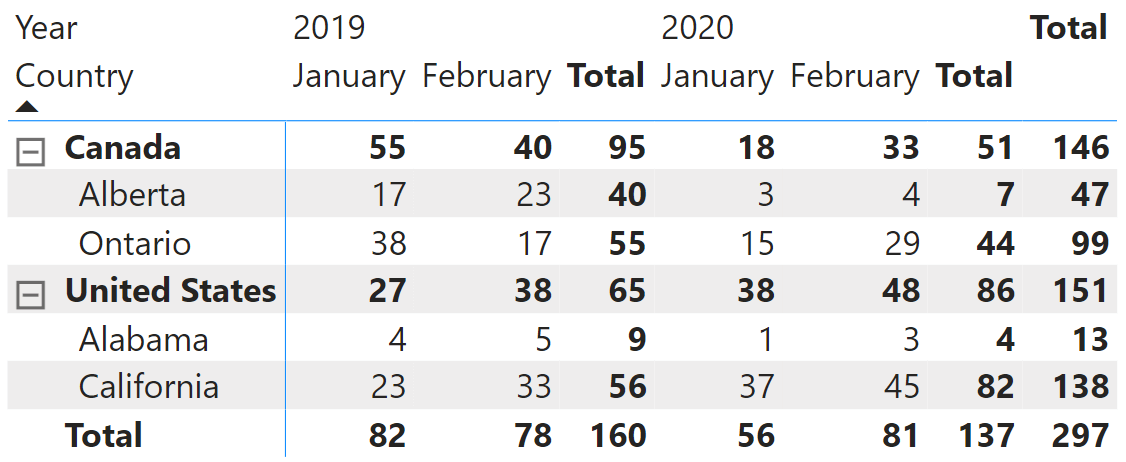
Once a virtual table is enhanced with VISUAL SHAPE, it can navigate its hierarchical structure by using the visual context functions EXPAND and COLLAPSE. Let us analyze the following matrix, which includes Country and State on the rows and Year and Month on the columns.
The VISUAL SHAPE definition is the following:
    TABLE '__DS0VisualCalcs' =
        __DS0VisualCalcsInput
        WITH VISUAL SHAPE
            AXIS rows
                GROUP [Country] TOTAL [IsGrandTotalRowTotal]
                GROUP [State] TOTAL [IsDM1Total]
                ORDER BY
                    [Country] ASC,
                    [State] ASC
            AXIS columns
                GROUP [Year] TOTAL [IsGrandTotalColumnTotal]
                GROUP
                    [Month],
                    [Month_Number]
                    TOTAL [IsDM4Total]
                ORDER BY
                    [Year] ASC,
                    [Month_Number] ASC,
                    [Month] ASC
            DENSIFY "IsDensifiedRow"
There are two axes (rows and columns), each with multiple levels for the group-by columns and each with its sort order. The virtual table contains several rows, many of which are just subtotals. To illustrate the different levels in the axis and the navigation between them, see the following figure, which shows the lattice of subtotals. The lattice includes all the possible combinations of levels and subtotals. In other words, the lattice shows the content of the virtual table organized in a way that simplifies navigating from one level to another.
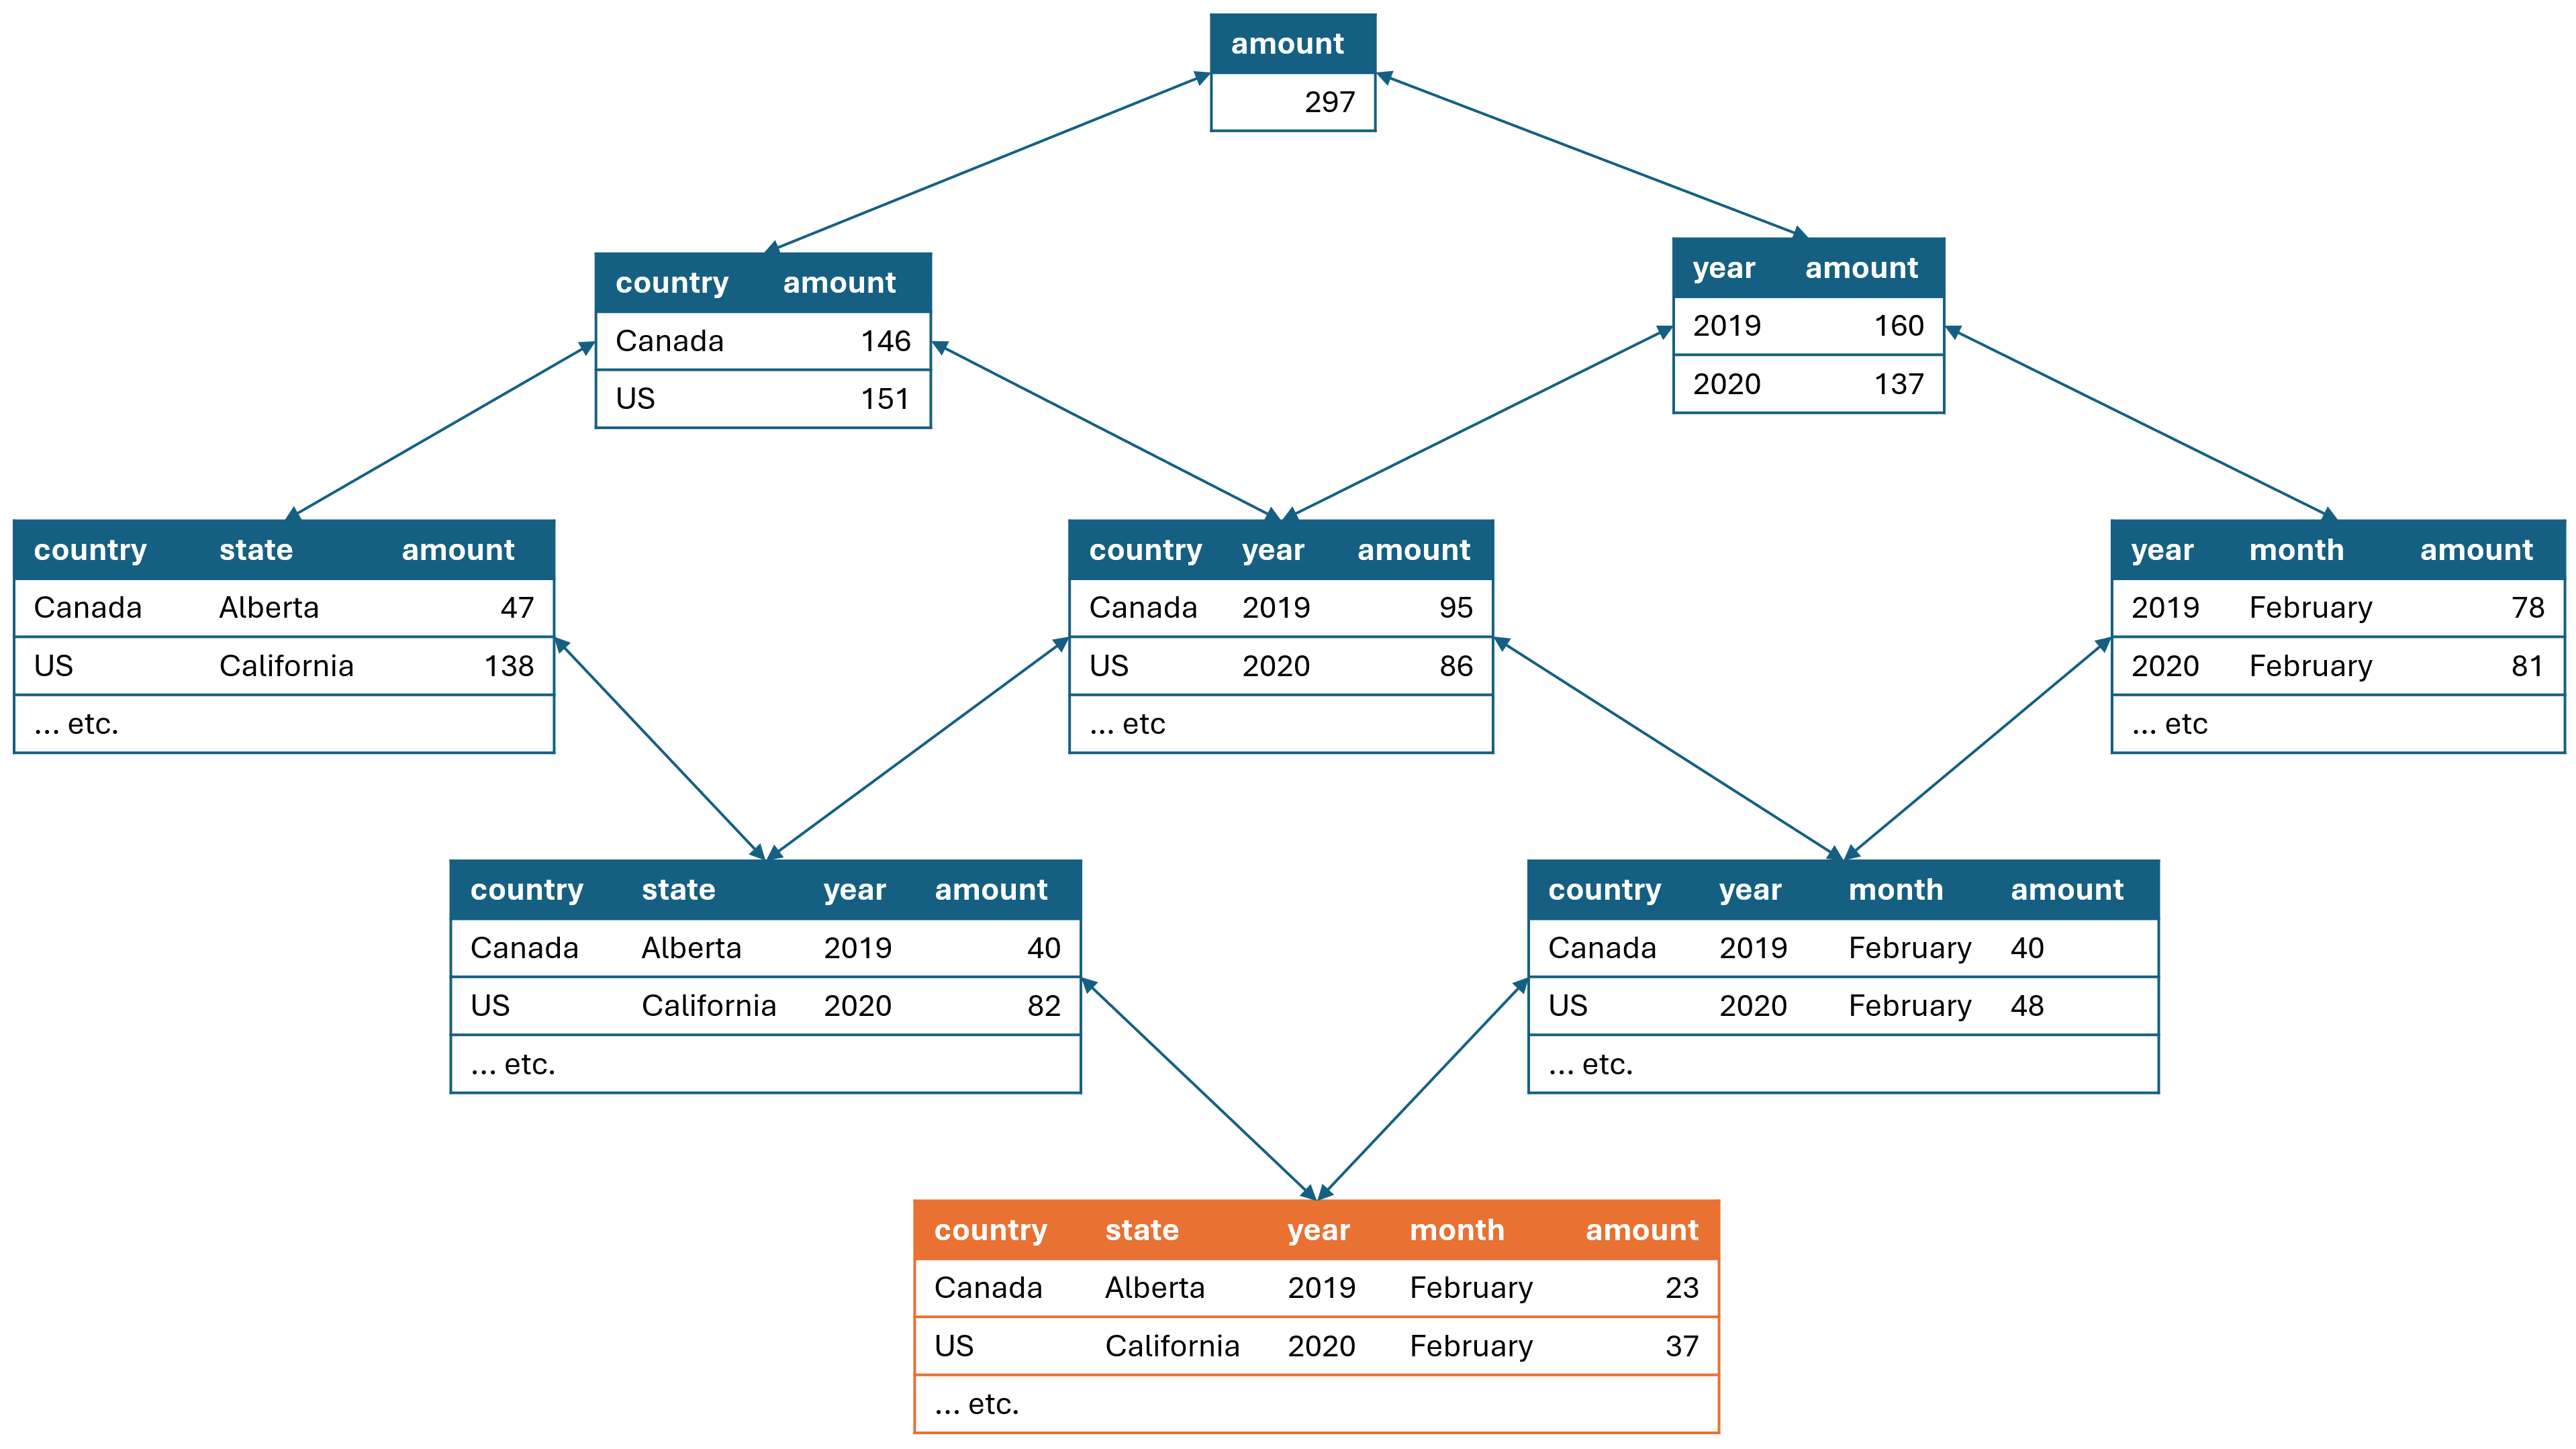
The most granular data is the bottom table, highlighted with a different color (orange). However, the virtual table includes all the subtotal rows. At each level of the hierarchical structure, some columns may be missing. For example, at the grand total level (the uppermost table in the previous diagram), the only column available is the amount measure, containing the grand total. All the group-by columns are missing.
A visual calculation is executed in the visual context. The visual context filters the current row(s) and also points to the element in the lattice which the current row belongs to. Indeed, when a matrix is showing the grand total, its current row only includes the amount column, whereas when the current row is at the country subtotal, its columns include both Country and Amount.
The visual context must not be confused with the row context or the filter context, which are established concepts in DAX. A row context exists in DAX because an iteration is taking place over a table. On the other hand, an active (non-empty) filter context exists if the model has filters. An empty filter context does not affect the model.
In visual calculations, there is no row context, no iteration happening by default, and filters work differently: they do not rely on the filter context, but instead on the visual context. The visual context undergoes a different set of rules than the row or filter contexts. The visual context filters rows in the visual shape, acting similar to both the row and the filter contexts at the same time. As a concept, it is more intuitive than the row context. However, for seasoned DAX developers, it requires some getting used to.
However, we will discuss the properties of the visual context in a dedicated article. For now, it suffices to say that the visual context is—basically—a set of rows in one of the elements of the virtual table lattice. Using EXPAND and COLLAPSE, the visual context can be moved to another element of the lattice.
Understanding EXPAND and COLLAPSE
EXPAND and COLLAPSE are operations that move the level of the visual context up or down in the hierarchy defined for the axis. Moving up (COLLAPSE) means going to the upper level: from months to years. Moving down (EXPAND) means going to the lower level: from years to months.
EXPAND and EXPANDALL start from the current visual context and move the level down. COLLAPSE and COLLAPSEALL perform the opposite operation. The functions can be used both as CALCULATE modifiers and as scalar functions. As scalar functions, they are just syntax sugar for the CALCULATE version.
Both EXPAND and COLLAPSE require specifying the axis and the number of levels to move up or down or one specific column to reach.
Let us start with a couple of simple examples. COLLAPSE navigates upward through the hierarchy. Using COLLAPSE ( ROWS, 1 ) moves the visual context up one level:
Parent Sales = CALCULATE ( [Sales], COLLAPSE ( ROWS, 1 ) )
Here is the result, showing at each level the value of the parent.
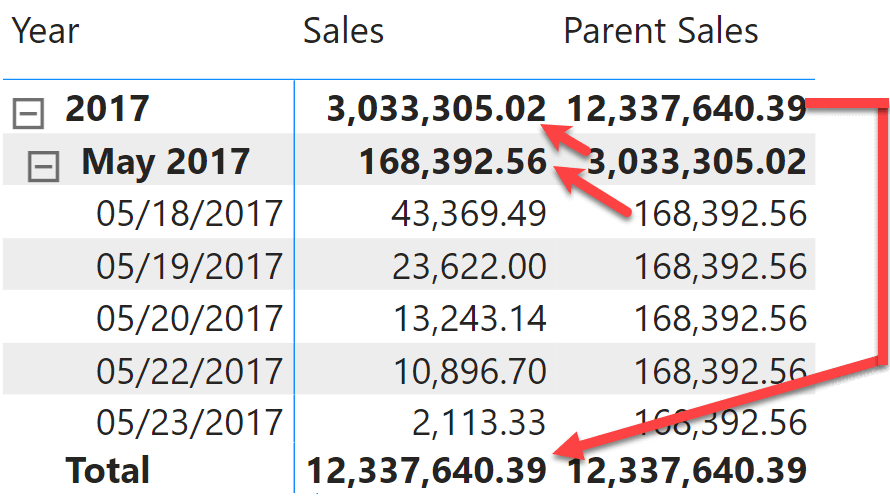
Please note that – by using COLLAPSE in the code – CALCULATE changes both the level of the visual context (going to the parent level) and the set of rows filtered in the virtual table.
It is possible to avoid using CALCULATE by using the scalar version of COLLAPSE:
Parent Sales = COLLAPSE ( [Sales], ROWS, 1 )
The scalar version of these functions is nothing but syntax sugar for the CALCULATE version.
COLLAPSE and EXPAND can also be used to directly go to the level specified by the column name in the visual shape, which is named after the corresponding hierarchy level in the model:
Year-Level Sales = COLLAPSE ( [Sales], [Year-Month Year] )
However, the syntax is somewhat misleading. One would expect the result to be the value of [Sales] at the year level. Instead, the result is the total.
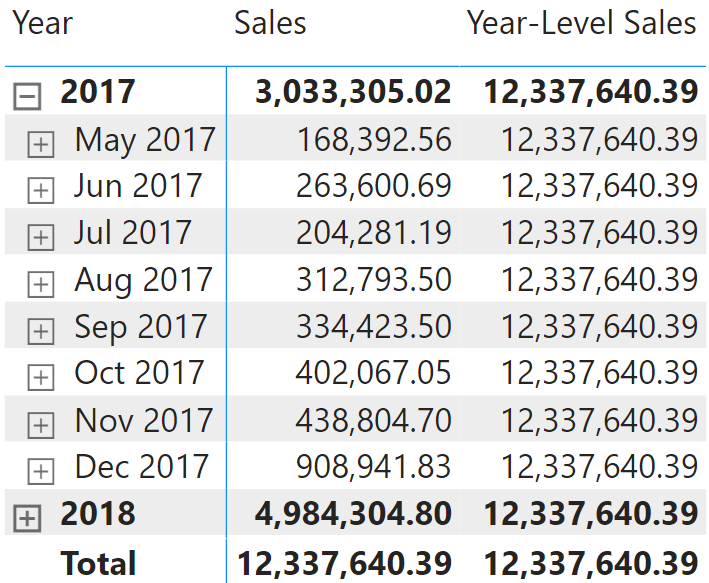
The reason for this unexpected behavior is that the column provided to COLLAPSE is not the level we want to reach. Instead, we reach the level above the column provided as an argument to COLLAPSE.
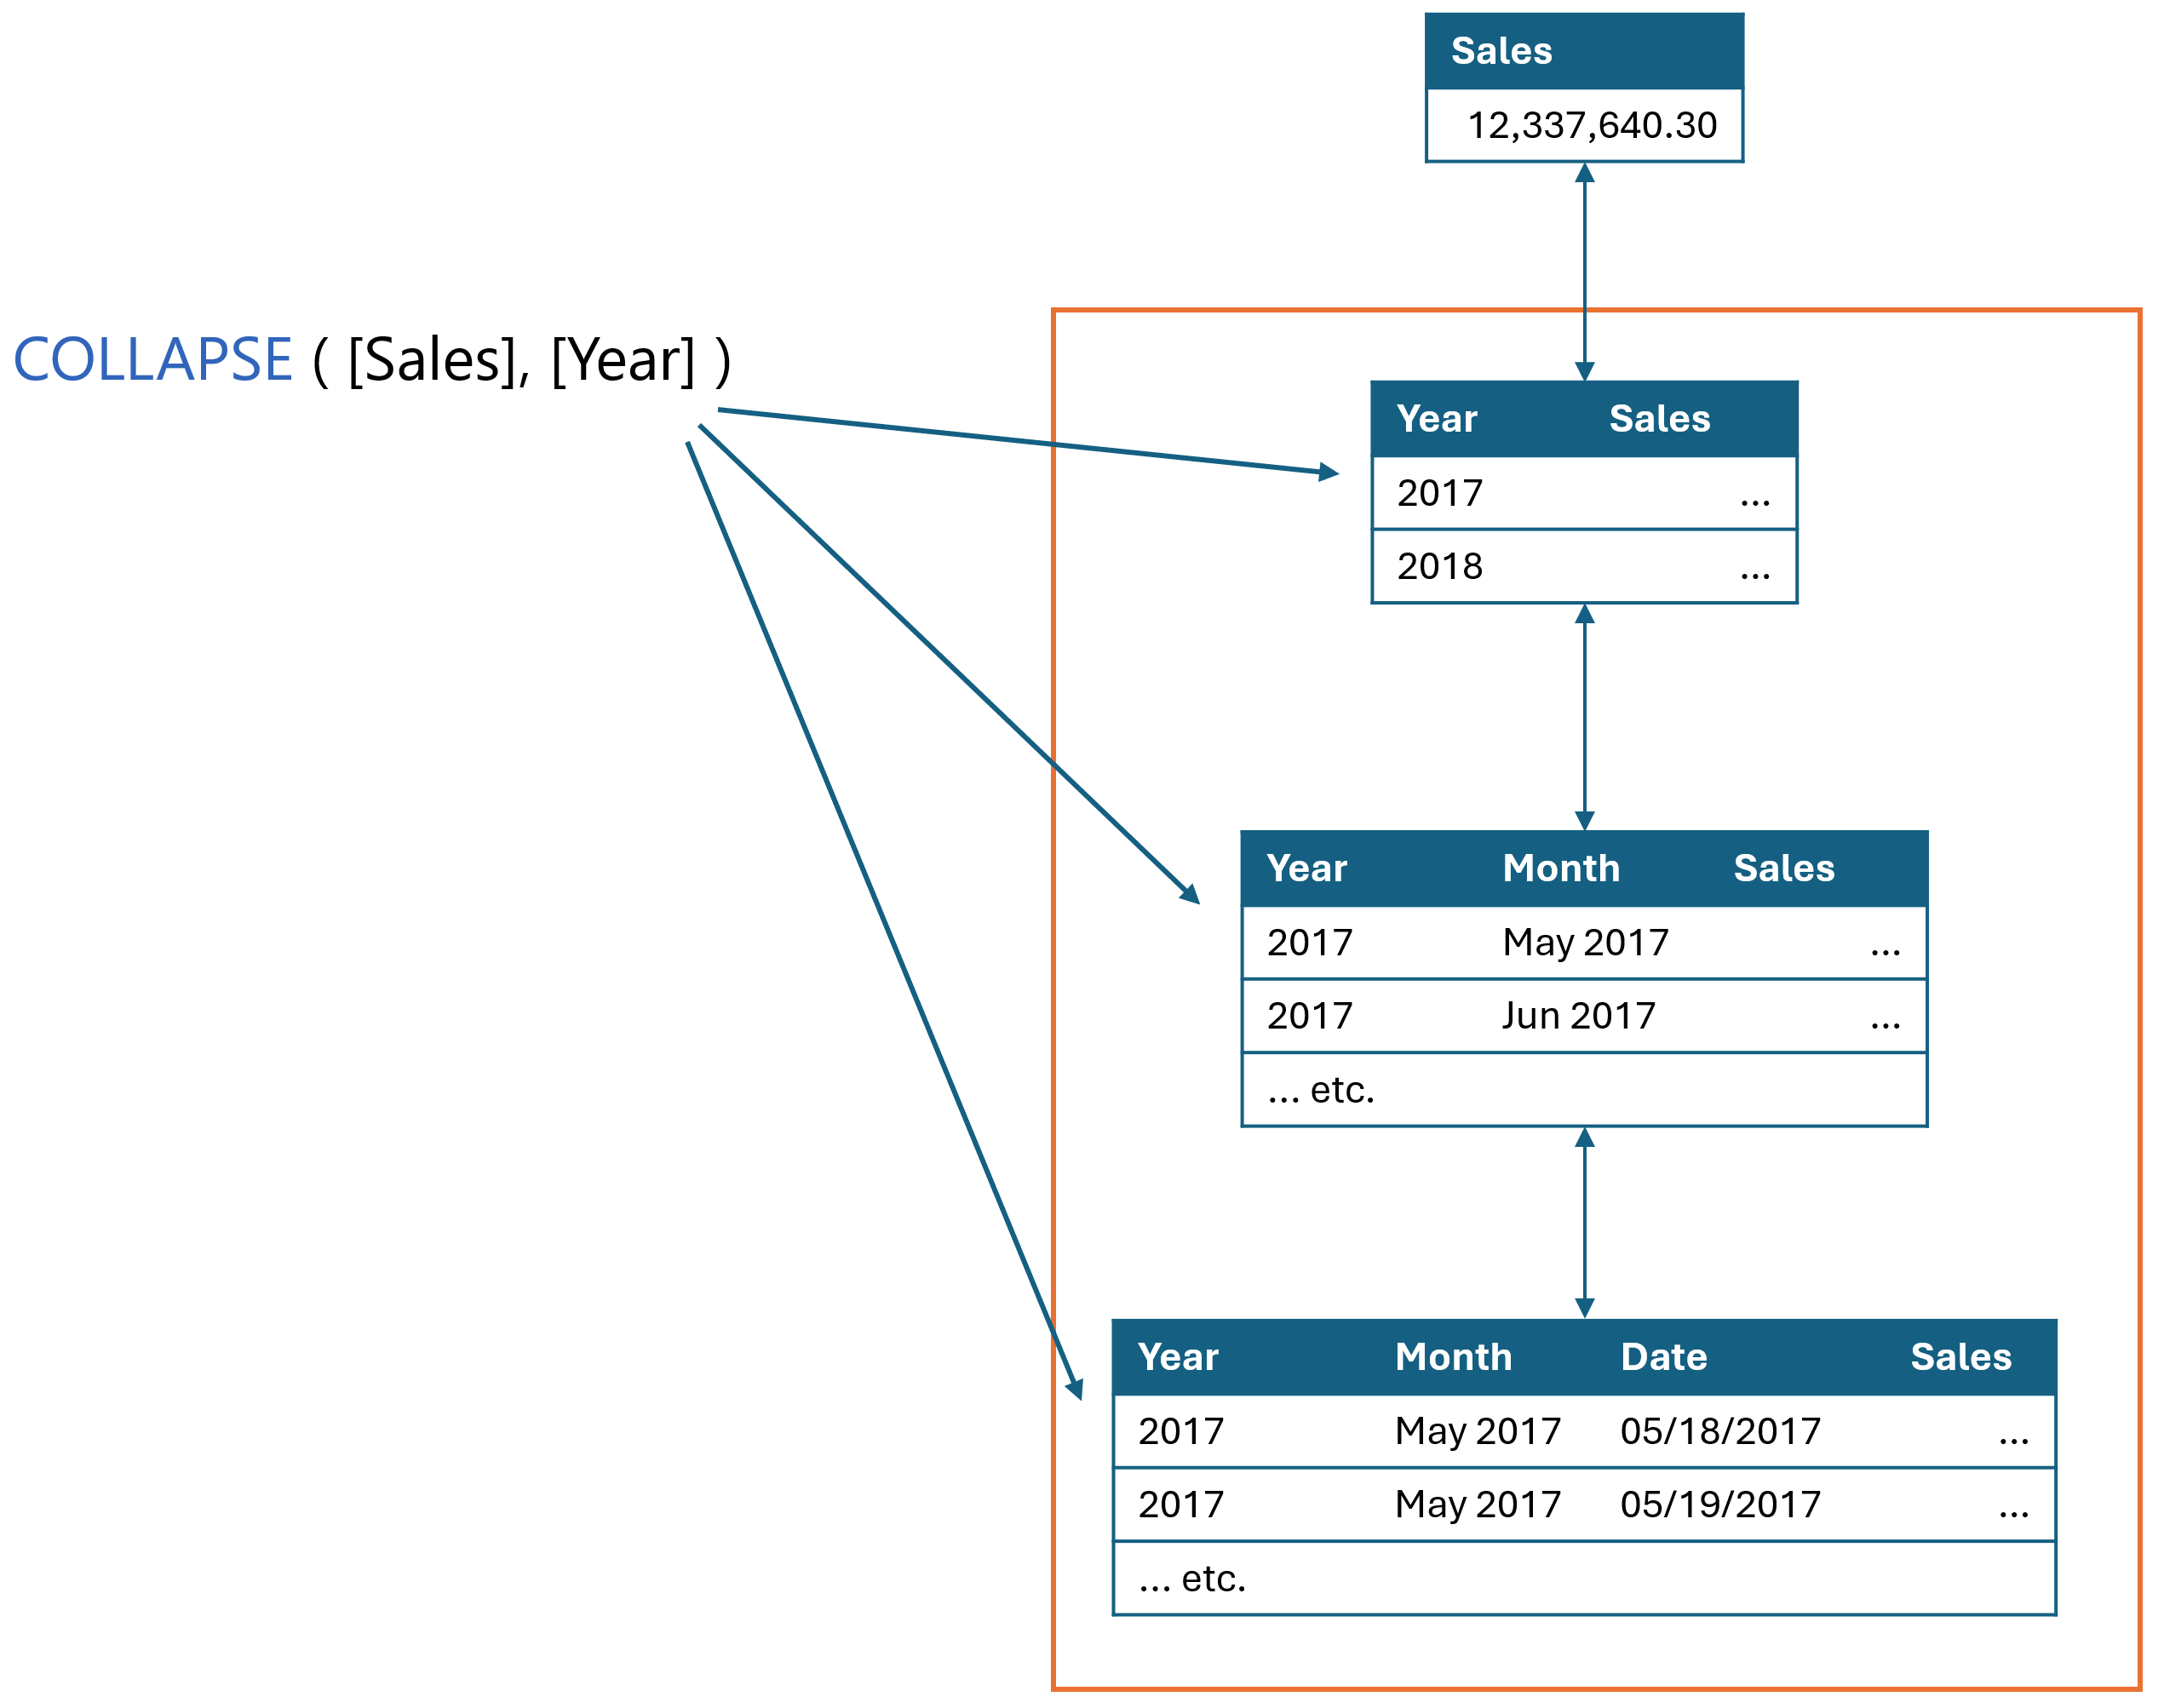
The semantics of COLLAPSE state that if the column is present in the current visual context, the new context contains the lowest level in the axis hierarchy that does not include the column. If the column is not present in the current visual context, then COLLAPSE does not move the visual context.
The following figure shows that the Year column is present on all levels except the grand total. Therefore, the grand total is the lowest level that does not include Year.
When you use COLLAPSE, the resulting visual context always contains one row: an ancestor of the row(s) in the current visual context. Consequently, you can reference column names without an aggregation function because only one row is available. When using EXPAND, things are very different. When using EXPAND, you go down one or more levels in the hierarchy, exposing multiple rows that are descendants of the current row. Therefore, aggregators become necessary to produce a scalar value.
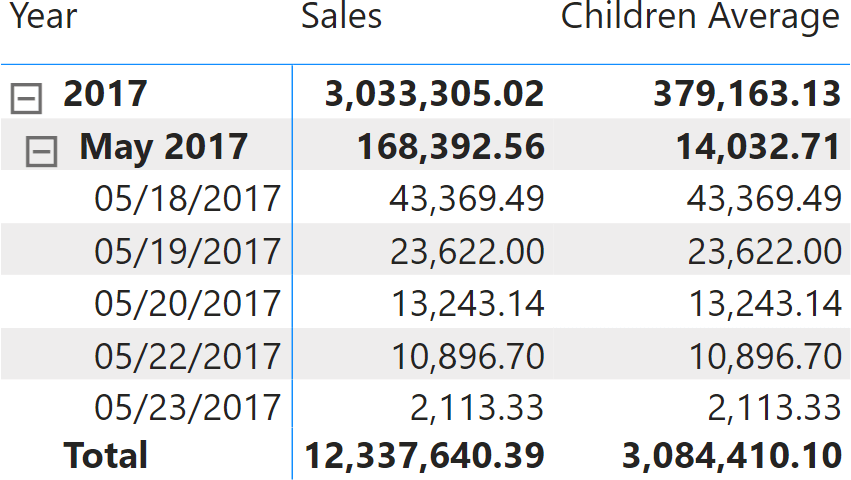
For example, if one needs to compute a visual calculation that produces the average of the children of the current level, then this is the code required:
Children Average = EXPAND ( AVERAGE ( [Sales] ), ROWS, 1 )
or
Children Average = CALCULATE ( AVERAGE ( [Sales] ), EXPAND ( ROWS, 1 ) )
The result is the average of the children at each level. The average at the lowest level of the hierarchy has the same value as Sales – like the date level in the following example.
When using EXPAND, there is always the possibility that multiple rows are included in the calculation. However, the same situation can happen with COLLAPSE too, if the DAX engine cannot figure out that the result includes only one row.
Like COLLAPSE, EXPAND can also be used with a column. In that case, it moves the visual context to the highest level of the axis hierarchy that includes the specified column. For example, using EXPAND with month moves the visual context to the highest hierarchical level that includes the month.
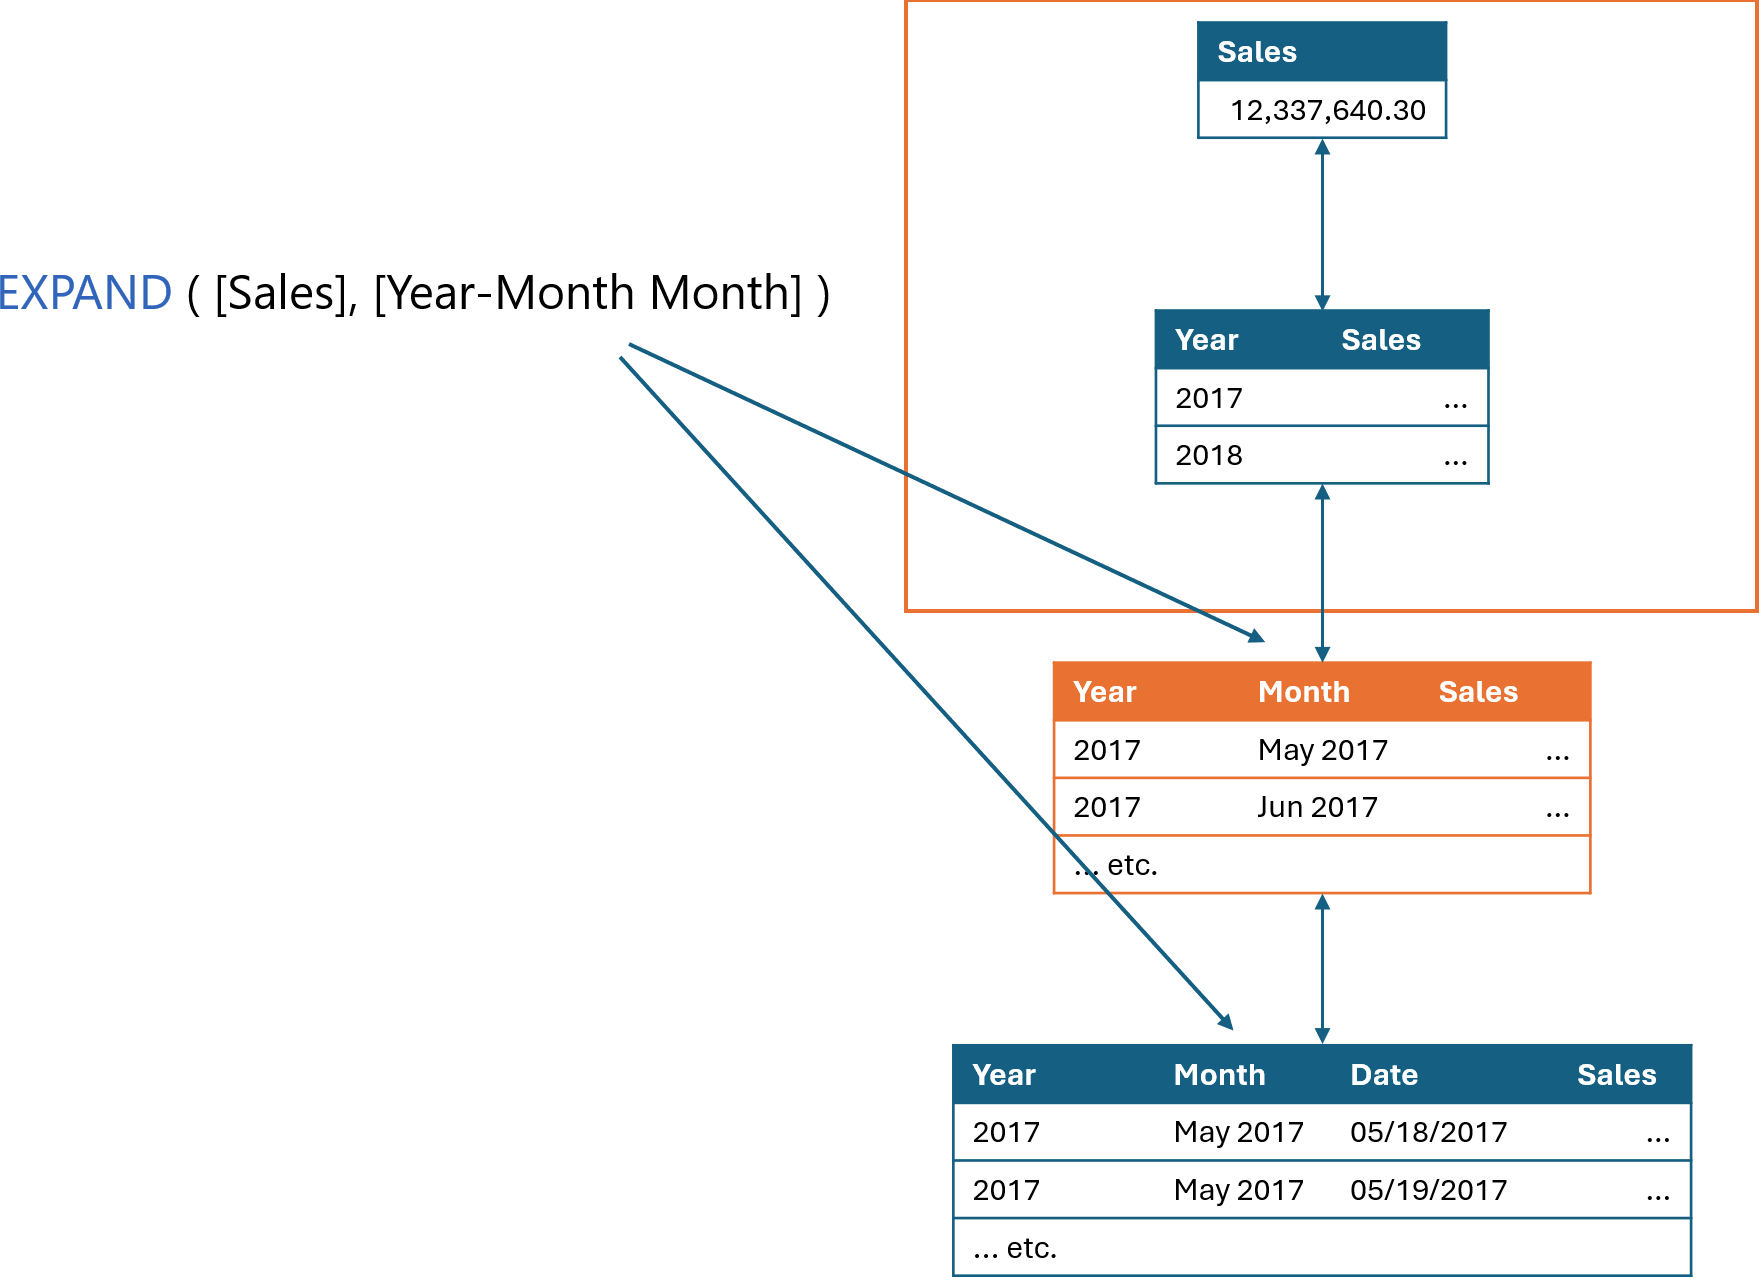
The first two levels do not contain the month level, and the bottom level does contain the month, but it is not the highest level containing the month. Therefore, EXPAND moves the visual context to the highlighted level.
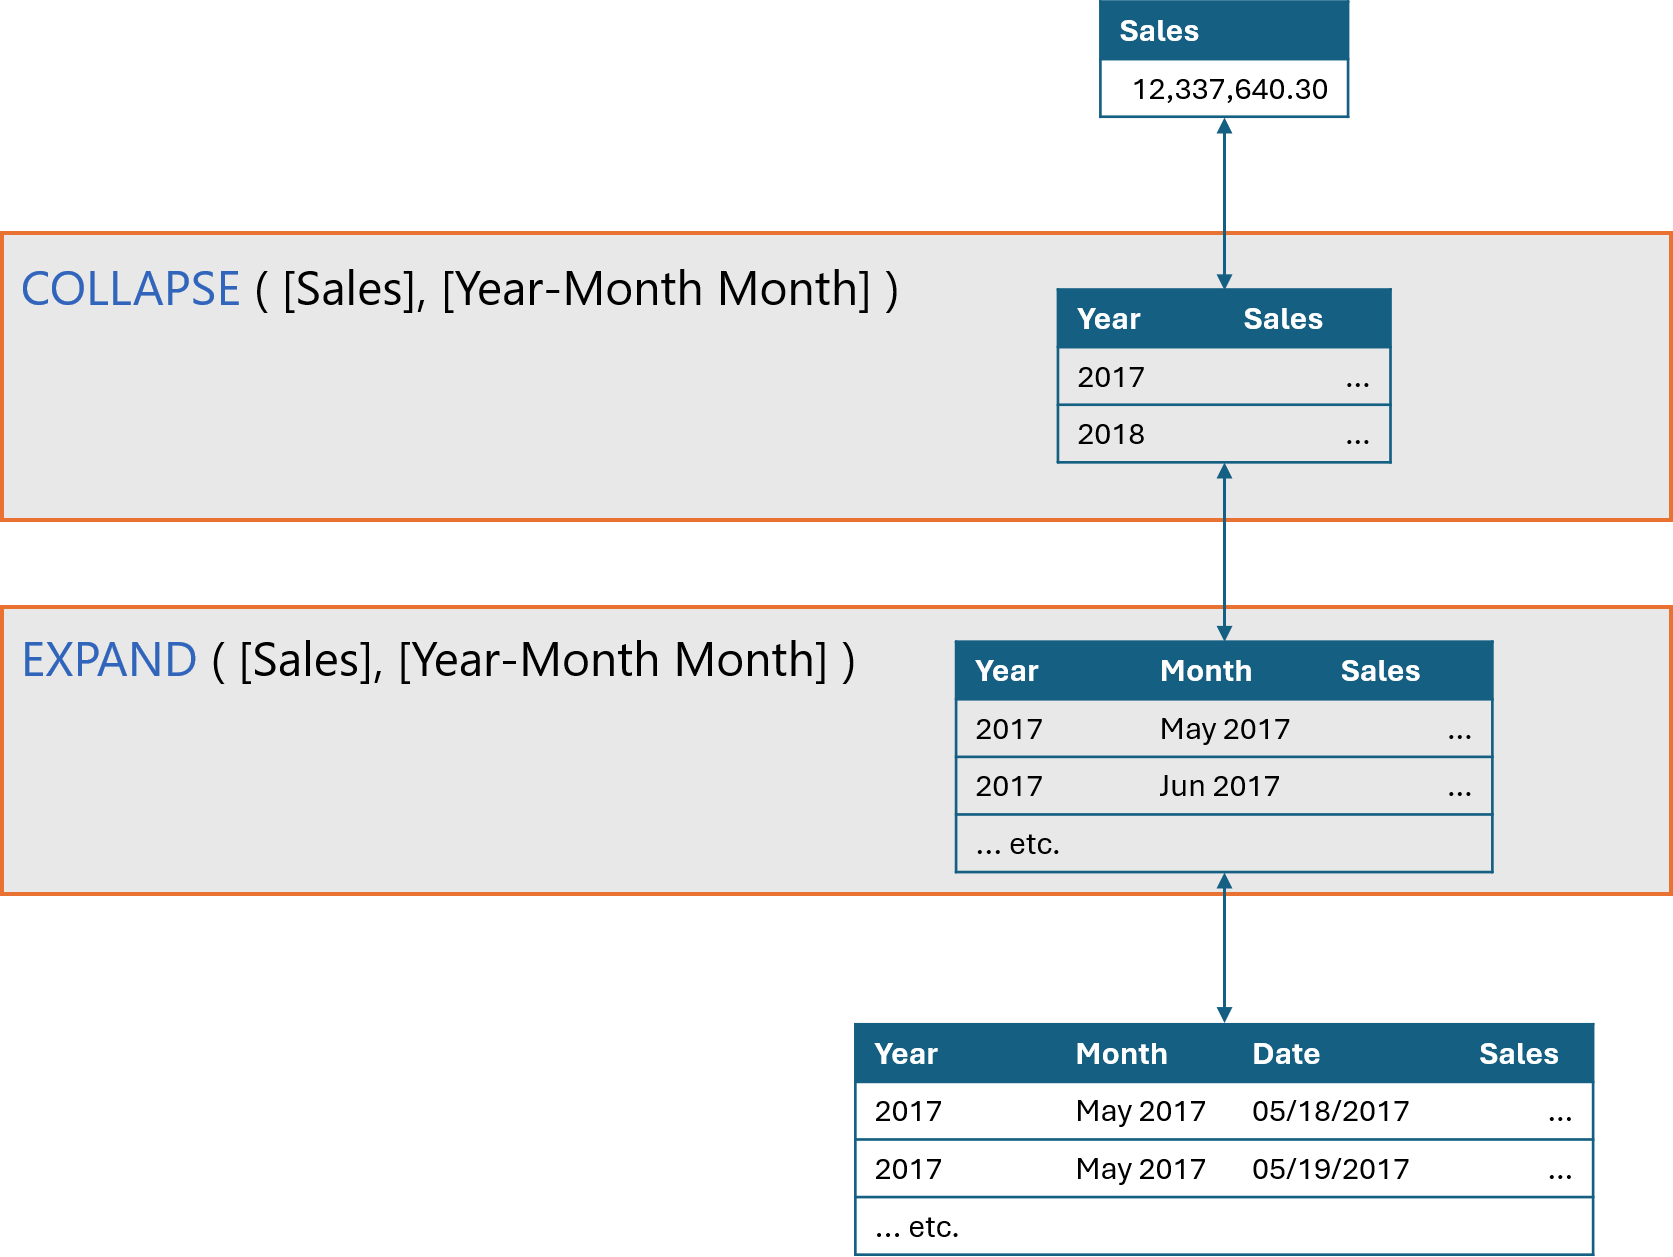
It is important to note that EXPAND and COLLAPSE, provided with one column, go to different levels. The following figure shows that COLLAPSE goes to the second level, whereas EXPAND goes to the third level, despite both being provided with the month column.
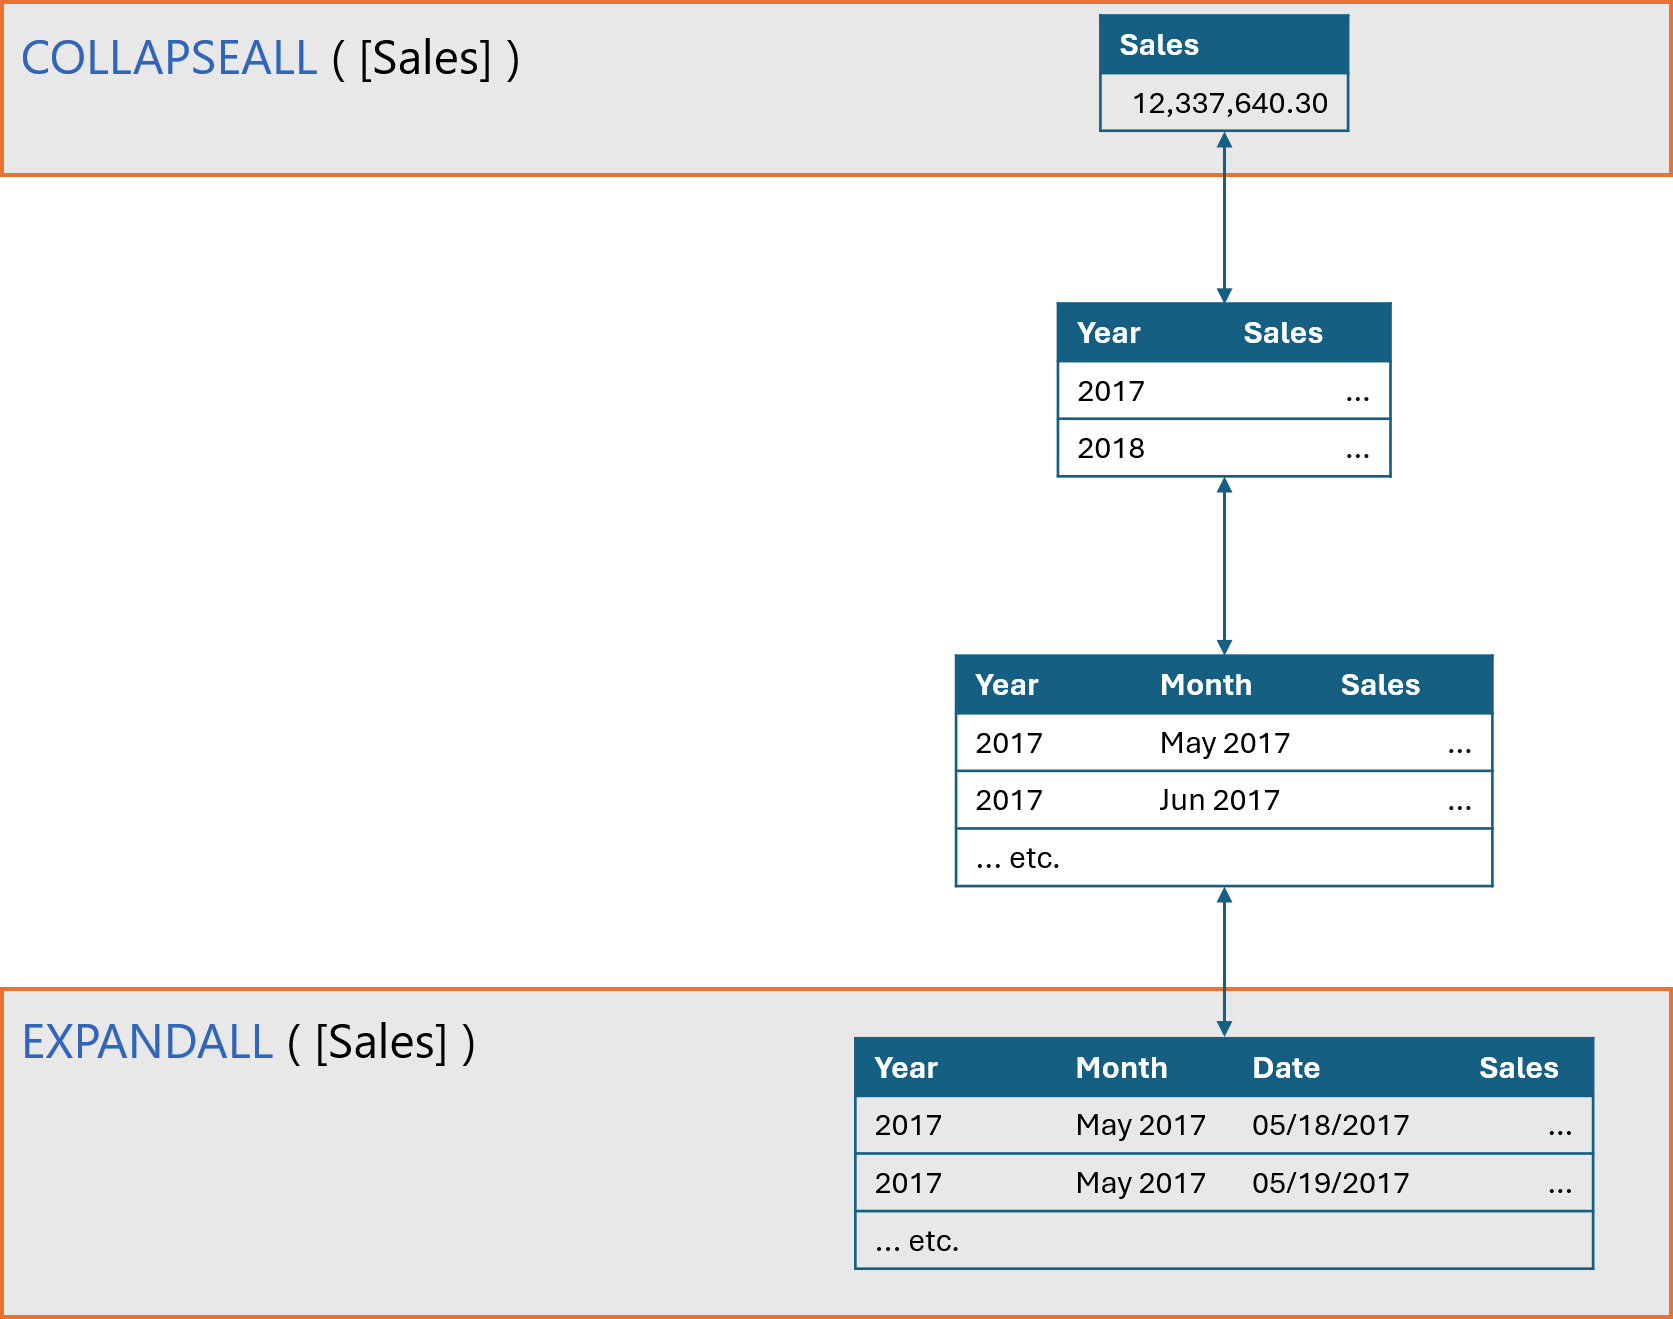
Finally, COLLAPSEALL and EXPANDALL calculate at the top (COLLAPSEALL) or bottom (EXPAND ALL) level of the axis hierarchy.
Using EXPAND and COLLAPSE properly is of vital importance to author visual calculations that work properly. For example, when placing a filter with CALCULATE, we always need to make sure that the column being filtered is available in both the filter argument and the expression evaluated by CALCULATE.
Conclusion
In this article, we introduced EXPAND and COLLAPSE. VISUAL SHAPE, the visual lattice and the basic EXPAND and COLLAPSE operations are the foundations of the visual calculation semantics. In future articles we will dive deeper into the visual context behavior and we will introduce basic visual calculations, with a complete description of their internal behavior. Our SQLBI+ readers interested in diving further into visual calculations will find the Visual Calculation whitepaper in their learning area in SQLBI+.
Retrieves a context with added levels of detail compared to the current context. If an expression is provided, returns its value in the new context, allowing for navigation in hierarchies and calculation at a more detailed level.
EXPAND ( [<Expression>] [, <Axis>] [, <Column> [, <Column> [, … ] ] ] [, <N>] )
Retrieves a context with removed detail levels compared to the current context. With an expression, returns its value in the new context, allowing navigation up hierarchies and calculation at a coarser level of detail.
COLLAPSE ( [<Expression>] [, <Axis>] [, <Column> [, <Column> [, … ] ] ] [, <N>] )
Retrieves a context with added detail levels along an axis compared to the current context. With an expression, returns its value in the new context, enabling navigation to the lowest level on the axis, and is the inverse of COLLAPSEALL.
EXPANDALL ( [<Expression>], <Axis> )
Retrieves a context with removed detail levels along an axis. With an expression, returns its value in the new context, enabling navigation to the highest level on the axis and is the inverse of EXPANDALL.
COLLAPSEALL ( [<Expression>], <Axis> )
Evaluates an expression in a context modified by filters.
CALCULATE ( <Expression> [, <Filter> [, <Filter> [, … ] ] ] )
Returns all the rows in a table, or all the values in a column, ignoring any filters that might have been applied.
ALL ( [<TableNameOrColumnName>] [, <ColumnName> [, <ColumnName> [, … ] ] ] )
Articles in the Visual Calculations series
- Introducing VISUAL SHAPE for visual calculations in Power BI
- Introducing EXPAND and COLLAPSE for visual calculations in Power BI
- Using EXPAND and COLLAPSE in visual calculations